
Your latest Node.js content, news and updates in one place.

Not every Node.js application is meant to live in the web; Node.js is a popular runtime allowing you to write multiple types of applications running on a variety of platforms—from the cloud to many IoT devices. Naturally, Node.js can also run in your local shell, where powerful tools can perform magic, executing useful tasks enhancing your developer capabilities.
A Command Line Interface (CLI), can perform anything from a simple operation—like printing ASCII art in the terminal like yosay—to entirely generating the code for a project based on your choices using multiple templates like Yeoman yo. These programs can be installed globally from npm, or executed directly using npx if they are simple enough.
Let's explore the basics of building a simple CLI using Node.js. In this example, we’re creating a simple command which receives a name as an argument displaying an emoji and a greeting.
The first thing you should do as in every application is to create a folder for it and execute:
$ npm init
The previous command will ask for some information like the package name, version, license, and others creating the package.json at the end, looking like this:
{
  "name": "hello-emoji",
  "version": "1.0.0",
  "description": "A hello world CLI with a nice emoji",
  "main": "index.js",
  "scripts": {
    "test": "echo \"Error: no test specified\" && exit 1"
  },
  "author": "edsadr",
  "license": "MIT"
}
As we want our CLI to be available as a command, we need to configure our package.json to treat our program like that, to do it we add a bin section like this:
"bin": {
  "hello-emoji": "./index.js"
}
In this case, hello-emoji is the command we are registering to execute our program, and ./index.js is the file to be executed when the command is invoked.
To display emojis, let's add a package:
$ npm install node-emoji -S
Now, let's create the file to be executed, index.js:
#!/usr/bin/env node
'use strict'

const emojis = require('node-emoji')

if (!process.argv[2]) {
  console.error(`${emojis.get('no_entry')} Please add your name to say hello`)
  process.exit(1)
}

console.log(`${emojis.random().emoji}  Hello ${process.argv['2']}!`)
Note that we add #!/usr/bin/env node at the top. This tells the system what interpreter to pass that file to for execution; in our case the interpreter is Node.js. After that, the code is fairly straightforward. It requires the node-emoji module and validates process.argv[2], which is the first argument placed by the user. By default process.argv[0] is the path for Node.js binary, and process.argv[1] is the path for the script being executed.
After adding this code, our command is ready to be executed; you can get a 'Hello world!' in your console by running:
$ node index.js world
If you want to run it using the command specified at the bin section of our package.json, you’ll need to install the package globally from npm. But just for development purposes to run it locally we can use:
$ npm link
After executing this command, you can try to execute:
$ hello-emoji world
Arguments parsing
After examining the code we just wrote, you’ll likely realize that the main issue when writing this kind of application is to control the user's input parsing the arguments included in the command execution. Fortunately, the npm ecosystem offers plenty of choices to solve this problem.
Here are some modules helping you to parse user-entered arguments. Some even provide some guidelines to structure your CLI's code:
- Yargs: https://www.npmjs.com/package/yargs
- Minimist: https://www.npmjs.com/package/minimist
- Commander: https://www.npmjs.com/package/commander
- Args: https://www.npmjs.com/package/args
These packages allow you to create a CLI supporting multiple operations and include parameters; you could efficiently structure something for our CLI to do things like:
$ hello-emoji --name=world --json
Printing a JSON object with our greeting
$ hello-emoji --name=world --emoji=coffee
Instead of a random emoji, this one prints the coffee emoji
Here is an example implementing minimist to do the parsing to execute commands like the ones above:
#!/usr/bin/env node

'use strict'

const emojis = require('node-emoji')
const minimist = require('minimist')
const opts = minimist(process.argv.slice(2))

const emoji = opts.emoji ? emojis.get(opts.emoji) : emojis.random().emoji

if (!opts.name) {
  console.error(`${emojis.get('no_entry')} Please add your name to say hello using the '--name=' parameter`)
  process.exit(1)
}

if (!emojis.has(opts.emoji)) {
  console.error(`${opts.emoji} is not a valid emoji, please check https://www.webfx.com/tools/emoji-cheat-sheet/`)
  process.exit(1)
}

const greeting = `${emoji}  Hello ${opts.name}!`

if (opts.json) {
  console.log(JSON.stringify({greeting}))
} else {
  console.log(greeting)
}
Going interactive
So far, we have been working with information coming from the command execution. However, there is also another way to help make your CLI more interactive and request information at execution time. These modules can help to create a better experience for the user:
- Inquirer: https://www.npmjs.com/package/inquirer
- Prompts: https://www.npmjs.com/package/prompts
- Prompt: https://www.npmjs.com/package/prompt
- Enquirer: https://www.npmjs.com/package/enquirer
With a package like the ones above, you could ask the user directly to input the desired information in many different styles. The example below is using inquirer to ask the users for the name if it was not included as an argument. It also validates the emoji and requests a new one if the input is not valid.
#!/usr/bin/env node

'use strict'

const emojis = require('node-emoji')
const inquirer = require('inquirer')
const minimist = require('minimist')
const opts = minimist(process.argv.slice(2))

let emoji = opts.emoji ? emojis.get(opts.emoji) : emojis.random().emoji

async function main () {
  if (!opts.name) {
    const askName = await inquirer.prompt([{
    type: 'input',
    name: 'name',
    message: `Please tell us your name: `,
    default: () => 'world',
    validate: (answer) => answer.length >= 2
    }])

    opts.name = askName.name
  }

  if (opts.emoji && !emojis.hasEmoji(opts.emoji)) {
    console.error(`${opts.emoji} is not a valid emoji, please check https://www.webfx.com/tools/emoji-cheat-sheet/`)
    const askEmoji = await inquirer.prompt([{
    type: 'input',
    name: 'emoji',
    message: `Please input a valid emoji: `,
    default: () => 'earth_americas',
    validate: (emoji) => emojis.hasEmoji(emoji)
    }])

    emoji = emojis.get(askEmoji.emoji)
  }

  const greeting = `${emoji}  Hello ${opts.name}!`

  if (opts.json) {
    console.log(JSON.stringify({
    greeting
    }))
  } else {
    console.log(greeting)
  }
}

main()
Adding some Eye Candy
Even if the interface for this kind of application is reduced to what you can have in a shell, it does not mean that the UI should look bad. There are plenty of tools that can help make your apps look good; here are some different libraries that will add a nice touch to the look of your CLI output:
- Chalk or Colors will allow you to set the color of your text.
- To include images translated to ASCII art, try asciify-image or ascii-art
- If you have to output much information a well-organized output could be in tables, try Table or Cli-table
- If your CLI requires processes taking some time, like consuming external APIs, querying databases or even writing files, you can add a cute spinner with Ora or Cli-spinner.
Conclusion
Creating user-friendly, useful and beautiful CLIs is part science and part art. After exploring the basics of creating a CLI tool, you can go and explore a universe of possibilities with the packages available through the npm registry. Hopefully, you’ll soon be creating functional and user-friendly tooling that’s missing from your current inventory thanks to the power of Node.js.
Read More
If you haven’t checked out the first two part of our ‘Diagnostics in Node.js’ series, click here and the second part here.
This is a 3-part blog series on Node.js. It is based on Colin Ihrig's talk at JSConf Colombia. The topics are separated by the age of diagnostic techniques - from the oldest to the newest:
- Part One: Debug Environment Variables, Warnings, Deprecations, Identifying Synchronous I/O and Unhandled Promise Rejections.
- Part Two: Tick Processor Profiling, The V8 Inspector, CPU Profiling, Heap Snapshots, Asynchronous Stack Traces.
- Part Three: Tracing, TLS Connection Tracing, Code Coverage, Postmortem Debugging, Diagnostics Reports.
Let’s begin! 🚀

Tracing
Tracing has been around in Node.js since version 6, but it has gotten more attention over the last few years. The Trace Event provides a mechanism to centralize tracing information generated by V8, Node.js core and userspace code.
By default the node, node.async_hooks, and v8 categories are enabled.
node --trace-event-categories v8,node,node.async_hooks server.js
You can execute --trace-event-enabled to get the output of several events that happened inside of Node.js. This can include accessing the file system, performance data, async hooks, and others. You can configure which events you want to see by using the flag --trace-event-category, allowing users to create custom trace events and use them for example to see how long an operation takes.
In chrome you can open chrome://tracing/, click the record button allowing you to visualize traces like this:
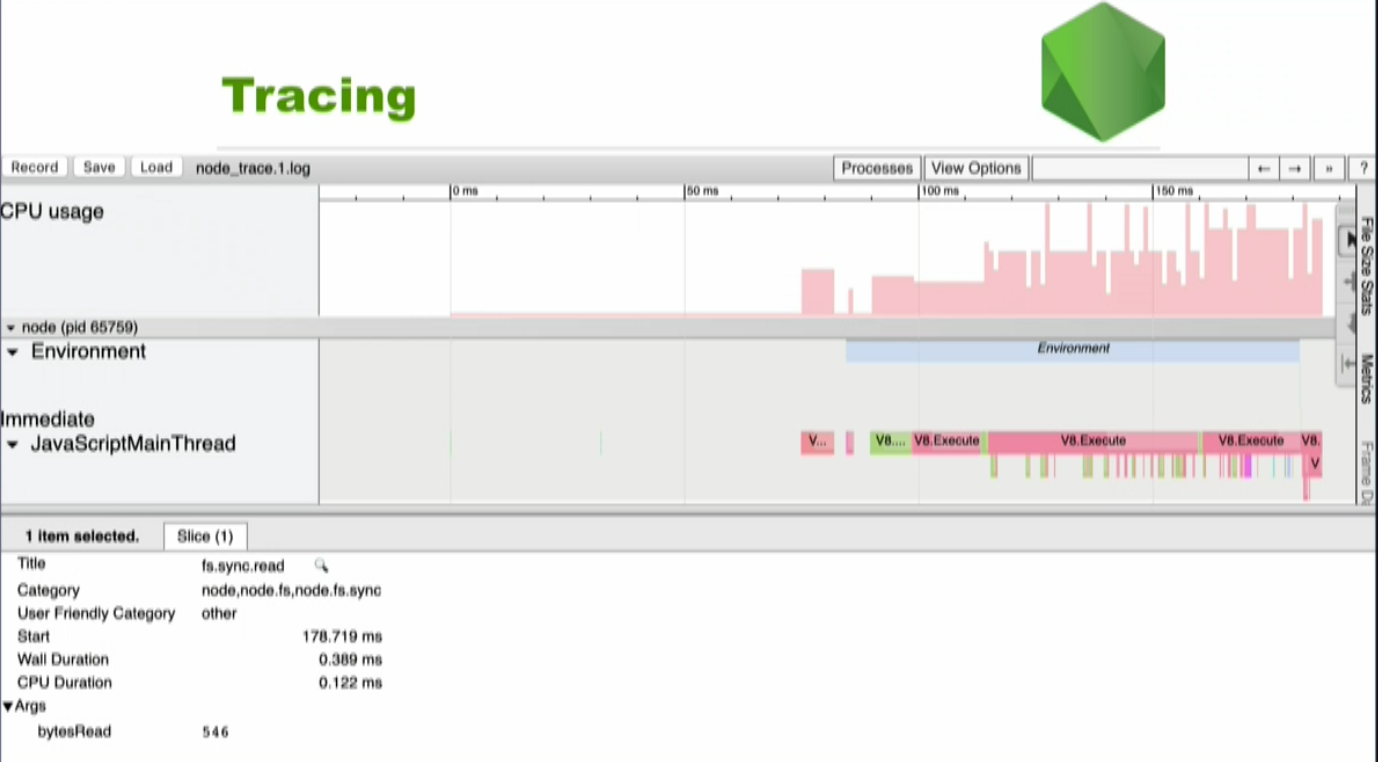
If you look at the bottom of the screen you can see fs.sync.read. This is the read operation of the file system. There are 546 bytesRead. It is also possible to see when the tracing started, how long it took, and the CPU Duration, which is all very useful for seeing what’s going on with your code.
TLS Connection Tracing
It is possible to use TLS Connection Tracing in more recent versions of Node.js. You may have experienced the following: You try to connect to a server via https but it doesn’t work. You get redirected to use the OpenSSL command line tool and it gets complicated. Now you can use the--trace-tls flag from the CLI for all TLS connections and you will get a significant amount of debugging information printed to the console every time you try to establish a TLS connection. The flag will work for all the connections in your application and you can establish the connection do it on a peer server or per socket instance.
Code Coverage
Code Coverage is a measurement of how many lines/blocks/arcs of your code are executed while the automated tests are running. In other words, it is measuring how well your test set is covering your source code. i.e. to what extent is the source code covered by the set of test cases.
Code coverage is collected by using a specialized tool to instrument the binaries to add tracing calls and run a full set of automated tests against the instrumented product. A good tool will give you not only the percentage of the code that is executed, but will also allow you to drill into the data and see exactly which lines of code were executed during a particular test.
V8 Code Coverage was the old way of measuring code coverage. It had many problems including the instrumentation of every line of code with counters and new language features lagging behind. Now V8 supports code coverage natively, and Node.js can take advantage of this using the NODE_V8_COVERAGE environment variable. This variable takes a string as its value which will be the name of a newly formed directory where you want to write your coverage information to.
Using coverage built directly into the V8 engine could address many of the shortcomings facing the previous transpilation-based approach to code coverage. The benefits being:
Rather than instrumenting the source-code with counters, V8 adds counters to the bytecode generated from the source-code. This makes it much less likely for the counters to alter your program’s behavior. Counters introduced in the bytecode don’t impact performance as negatively as injecting counters into every line of the source (it’s possible to notice a 20% slowdown in Node.js’ suite vs 300%). As soon as new language features are added to V8, they are immediately available for coverage.
The coverage information that is generated by V8 is a JSON format that is hard to understand if you look it up yourself. However, there are tools like c8 that can help you with this. The following is an example of using c8 with npx.
if (process.argv[2] === 'foo')
   console.log('got the foo arg');
else
   console.log('did not get the foo arg');
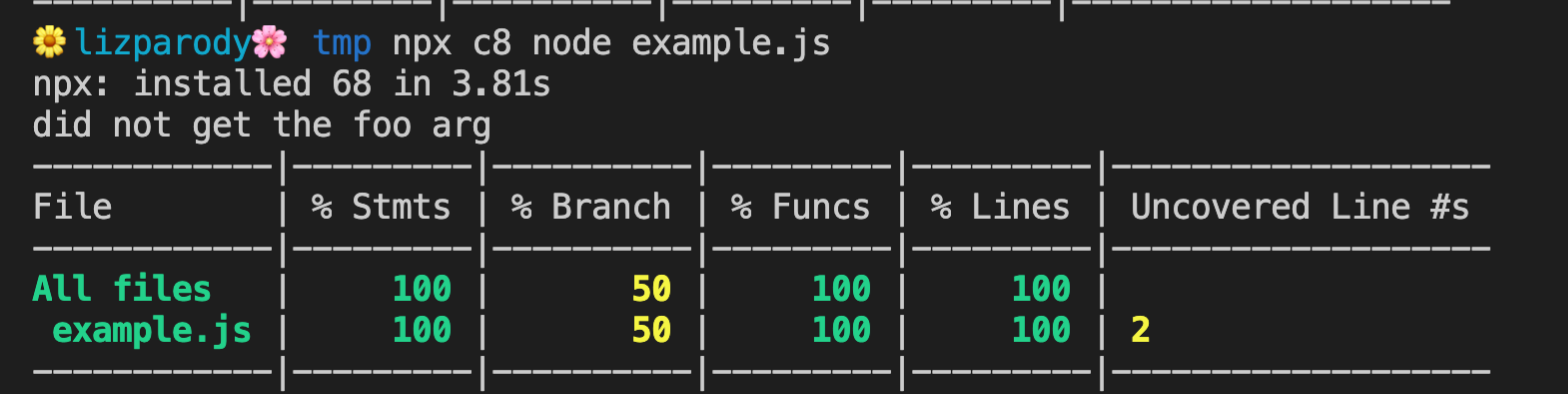
In this example, process.argv was called with no other arguments in the command line. In this case the output is ‘did not get the foo arg’. C8 will print out a list of all the files and highlights coverage percentiles for all statements, branches, functions, lines and uncovered lines. There are ways that you can get a more detailed view. For instance you can open a file and you can investigate its coverage line by line.
Postmortem Debugging
The shortcomings of traditional debugging tools have led to the rise of a separate class of debugging, referred to as postmortem debugging. This typically consists of capturing a core dump of a process when it crashes, restarting the process, and analyzing the core dump offline. This allows the process to be debugged while keeping the production system running.
Postmortem Debugging is another way to get valuable information out of Node.js. The problem with Postmortem Debugging is that it has a very high barrier of entry, as it is necessary to set up your system to collect core files.
Core files are an exact snapshot of an application when it crashes. They are turned off by default in most operating systems because the core files can get quite large. As such you have to enable it and then run Node with the flag --abort-on-uncaught-exception.
Once you get a core file you can analyze it with llnode which gives you deep insides into stack frames across the javascript and c++ boundaries. This allows you to inspect JavaScript objects to obtain more information about the crash. It is worth noting that most tools don’t give that type of visibility.
Another problem with this approach, is that tools like llnode depend heavily on the internals of V8. As such it tends to break every time node upgrades its version of V8. This problem led to another recent addition to Node which are Diagnostics Reports.
To see examples and more information of this too, read this blog post.
Production Diagnostics
Another way to access diagnostics is NodeSource’s Enterprise Node.js Runtime called NSolid. It solves the challenge of generating diagnostic assets such as CPU Profiles and Heap Snapshots in production, without requiring external packages or instrumentation of your code.
You can simply run your existing Node.js apps on our Node.js Enterprise runtime and NSolid magically exposes performance, diagnostics and security capabilities under the hood with low enough overhead that it can all be done in production.
[INSERT DEMO VIDEO HERE] https://vimeo.com/417916871/0f2767ff9c
Find out more here
Diagnostics Reports
It’s possible to think of Diagnostics Reports as light-weight Postmortem Debugging. We don’t get the same level of detail we can access in a core file, but it has a much lower barrier of entry and is more configurable.
The report does not pinpoint the exact problem or specific fixes, but its content-rich diagnostic data offers vital hints about the issue and accelerates the diagnostic process.
You will be able to generate Diagnostics Reports on a signal such as a crash or an uncaught exception. They are programmatic APIs inside of Node.js allowing you to execute process.report.getReport which generates a JSON object containing data about the system, the node process, libuv information, c++ stack and more.
Diagnostic Reports de this by using a tool called First Failure Data Capture (FFDC). It is designed to instantly collect information about what led to a failure so that users don’t need to re-create the failure.
This Diagnostic Report is generated in a semi man-machine readable format. This means you can read it in its original state if you’re moderately skilled at diagnostics reporting or it can be loaded into a JS program or passed to a monitoring agent. The resulting file contains information about the state of the application and the hosting platform, covering all vital data elements.
This document can improve the overall troubleshooting experience because it: Answers many routine questions which can reduce the number of iterations needed to understand the cause of the failure. It offers a comprehensive view of the state of the application and virtual machine at the time of failure. This information can drastically improve decision making for the next set of data collection, if required. Ideally, the FFDC enables someone to resolve the issue without any additional information!
Diagnostic Reports are still experimental, but because it is not code that is going to really impact your running application it is recommended to use it.
The following command line argument runs Diagnostic Reports:
$ node--experimental-report --diagnostic-report-uncaught-exception w.js

Writing Node.js report to file: report.20190309.102401.47640.001.json
Node.js report completed
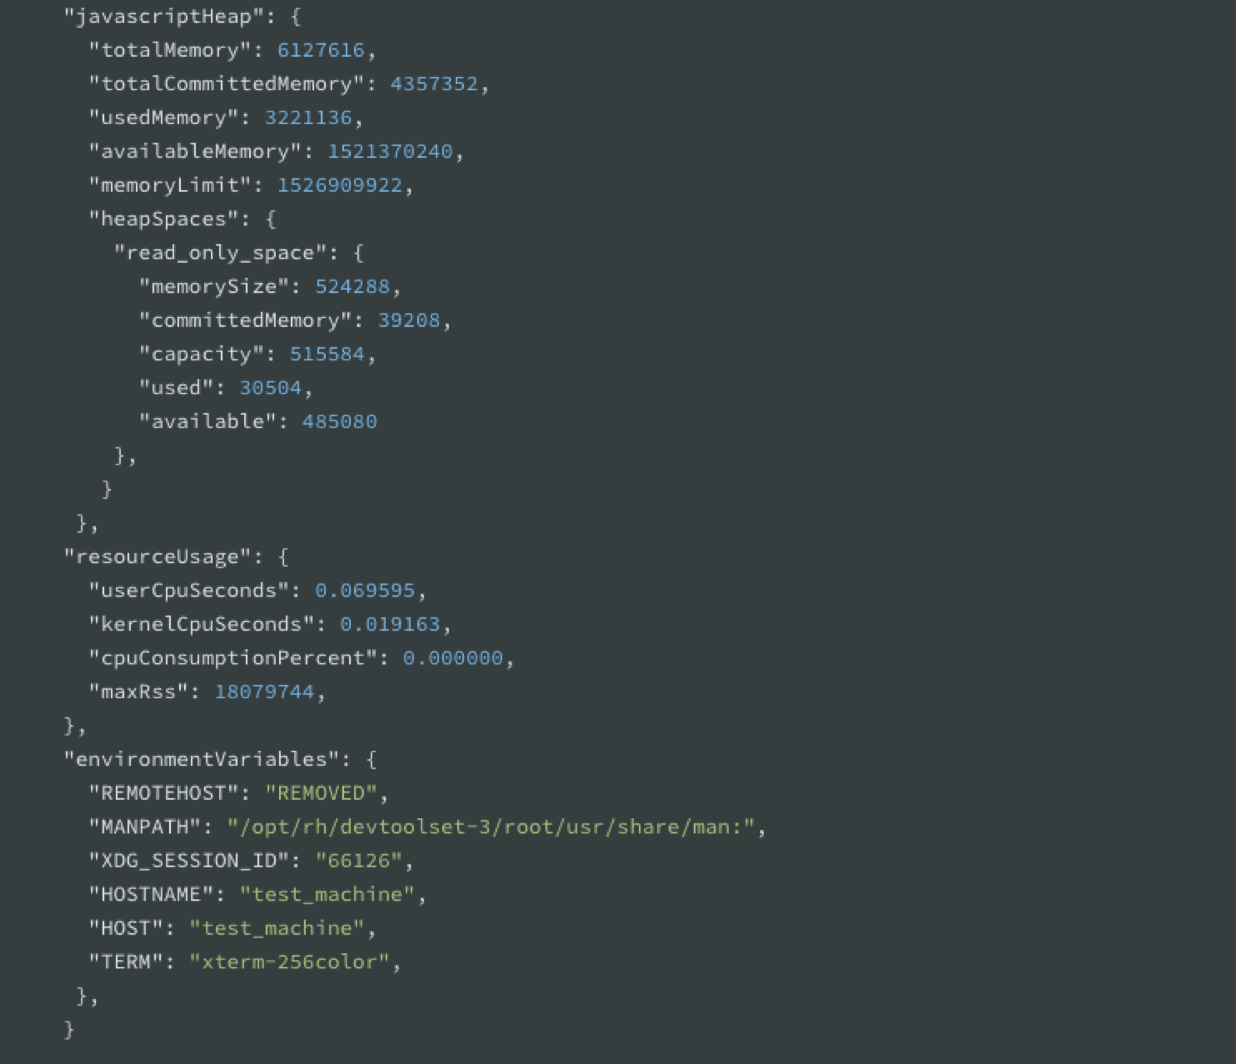
The data it captures can be correlated with anomalies like fatal errors that terminate the program, application exceptions, or any other common failure scenarios. The data the tools actually captures are JavaScript heap statistics, native and application call stack, process’ CPU consumption, and more.
There are a hand full of flags that you must use to configure it:
--experimental-report=> because it is still experimental, this flag will enable Diagnostic Reports.--report-on-fatalerror=> If you are interested in collecting information when node crashes in the c++ layer--report-uncaught-exception=> If you are interested in JavaScript uncaught exceptions--report-on-signal=> if you want to send a specific signal to your process and have it generate this report--report-signal=signal=> you can define which signal you want to use, by default it uses sigUser2--report-directory=directory=> lets you specify where you want to write these reports to--report-filename=filename=> lets you specify the file-name of these reports (by default is the year, date and other stuff)
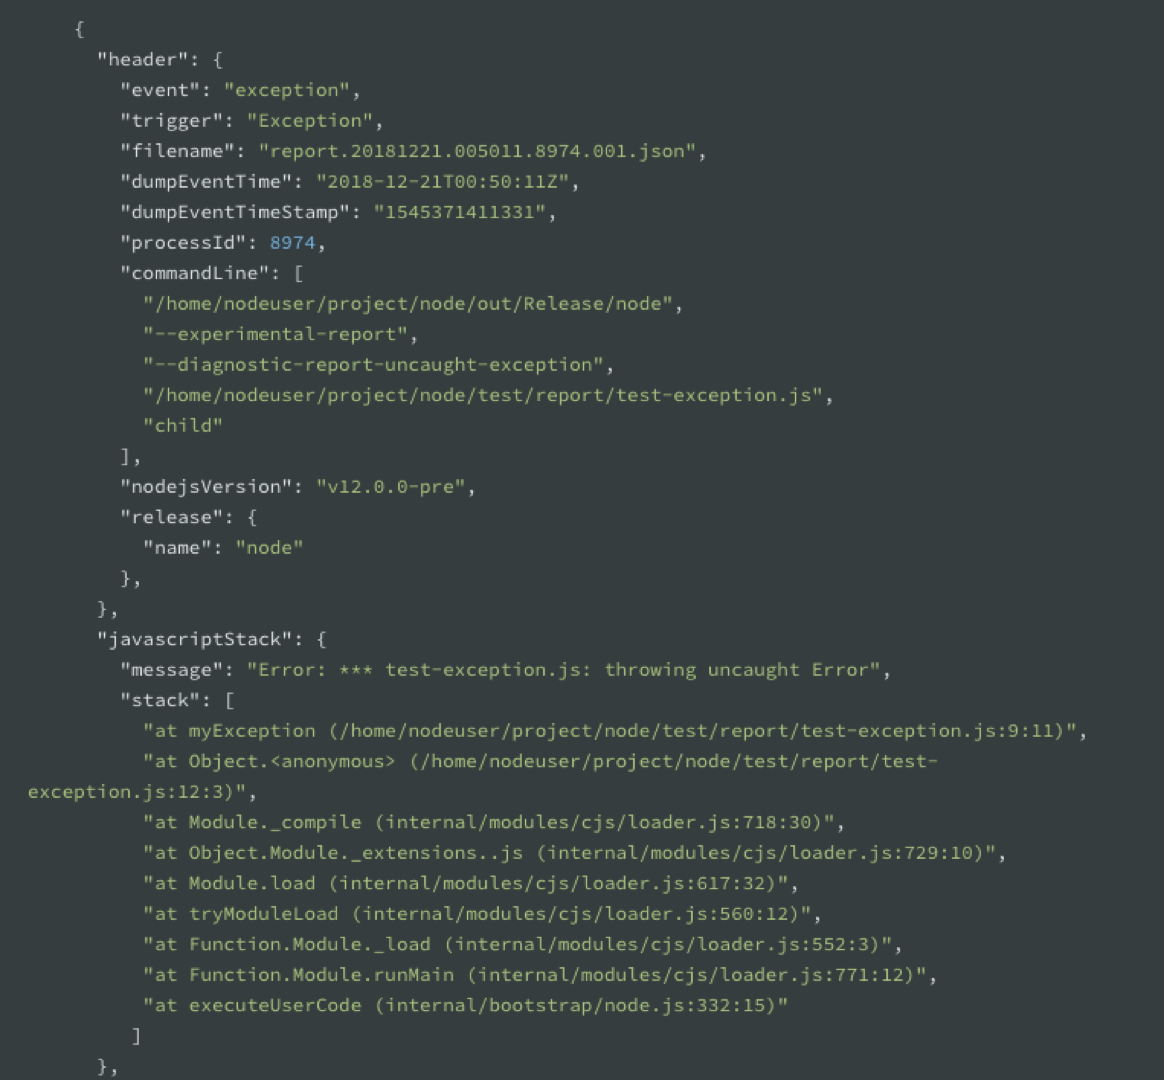
This is how the report looks like: A big JSON object that contains event, trigger, timestamps, processId, and the commandLine flags you used.
References:
Easily identify problems in Node.js applications with Diagnostic Report
Rethinking JavaScript Test Coverage
Easily identify problems in Node.js applications with Diagnostic Report
What is code coverage and how do YOU measure it?
Read More
If you haven’t checked out the first part of Diagnostics in Node.js, click here.
This is a 3-part blog series on Node.js. It is based on Colin Ihrig's talk at JSConf Colombia. The topics are separated by the age of diagnostic techniques - from the oldest to the newest:
- Part One: Debug Environment Variables, Warnings, Deprecations, Identifying Synchronous I/O and Unhandled Promise Rejections.
- Part Two: Tick Processor Profiling, The V8 Inspector, CPU Profiling, Heap Snapshots, Asynchronous Stack Traces.
- Part Three: Tracing, TLS Connection Tracing, Code Coverage, Postmortem Debugging, Diagnostics Reports.
Let’s begin! 🚀
Tick Processor Profiling
When dealing with web applications, we want to provide the best possible performance to our users. Using a profiler can help you identify bottlenecks leading into your application. This can further reduce the amount of time spent in a request such as accessing a database or waiting for an API call to respond.
One of those profilers is V8’s built-in sample-based profiler. Profiling is turned off by default, but can be enabled via the --prof command-line option, which dumps V8-profiler-output into a file. The sampler records stacks of both JavaScript and C/C++ code.
This is a 2-step process: first, you are able to profile your code as it is running. This will dump a file that is not meant to be consumed by humans: the file is called isolate-0x[numbers]-v8.log . The second step takes that output and formats it in a way that is human readable code. This can be done using the flag --prof-process.
The isolate-0x[numbers]-v8.log file looks like this:
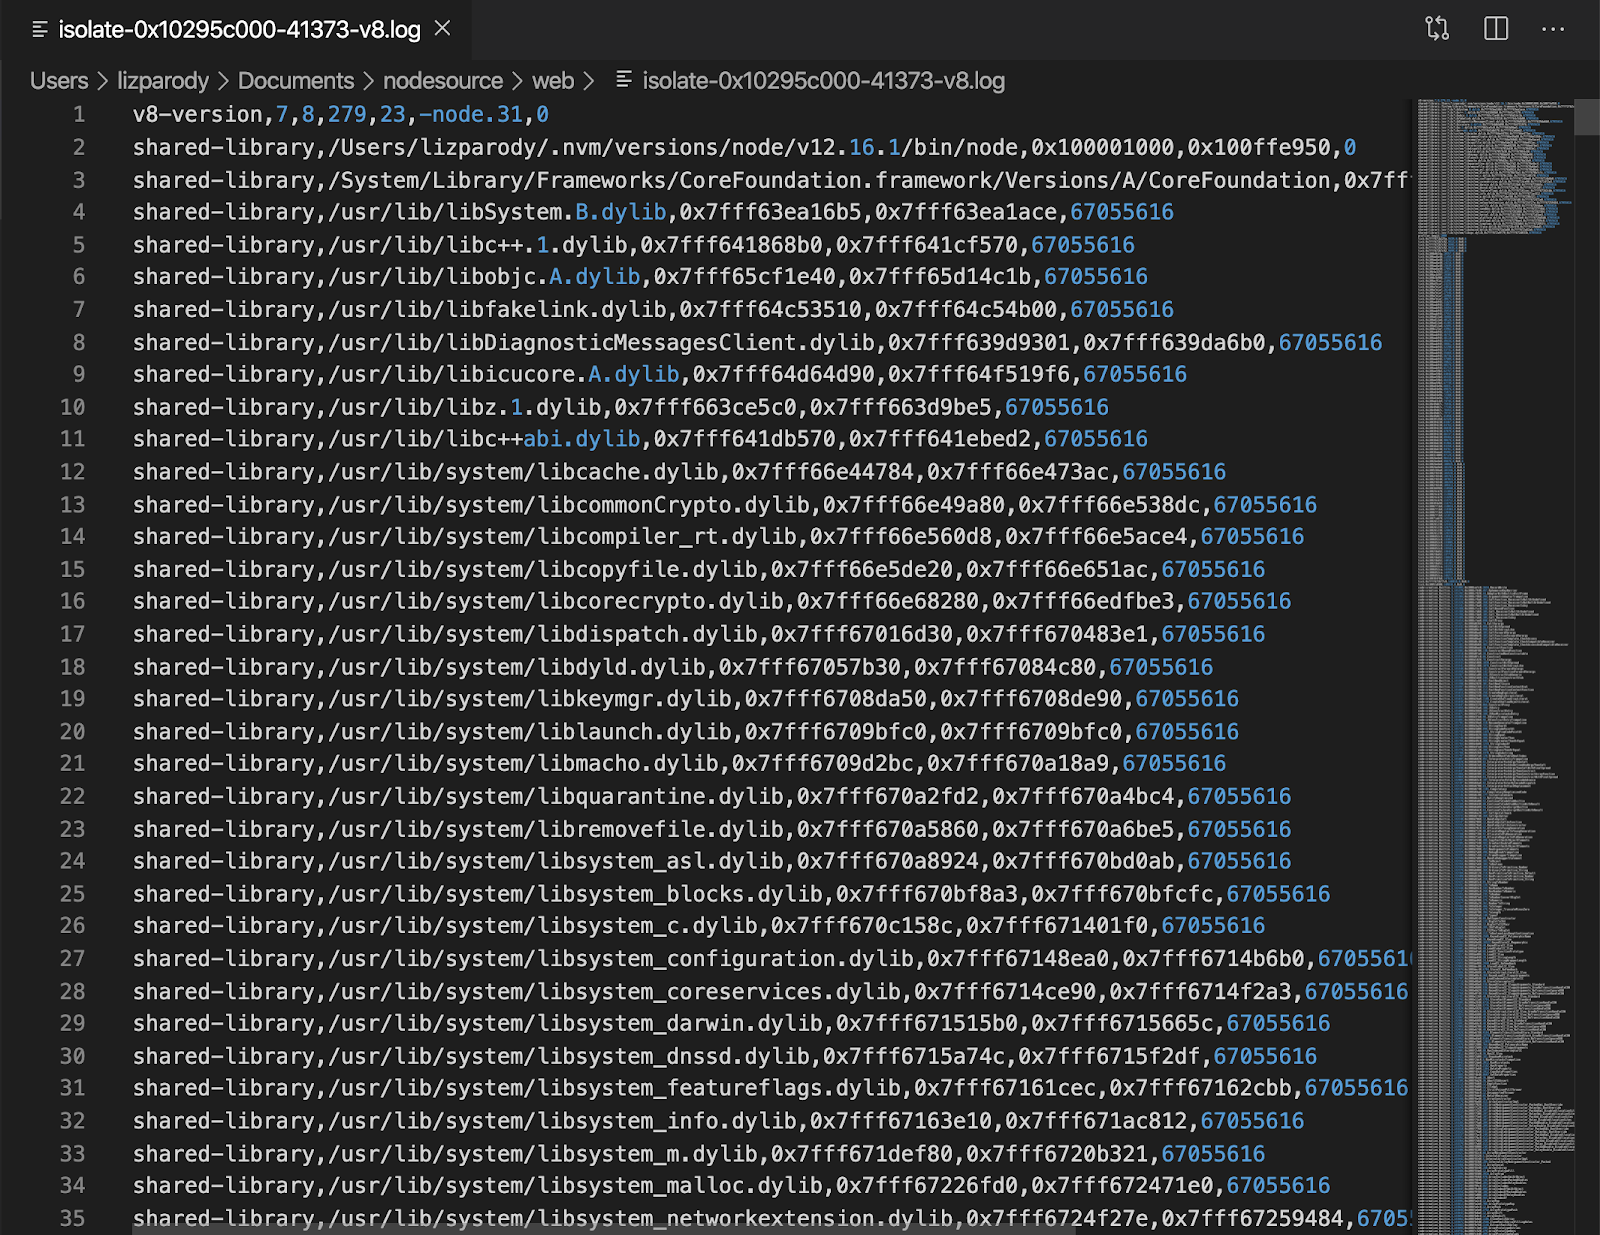
Then you can run node --prof-process isolate-0x[numbers]-v8.log and the file will look like this:
i.e.
node --prof-process isolate-0xnnnnnnnnnnnn-v8.log > processed.txt
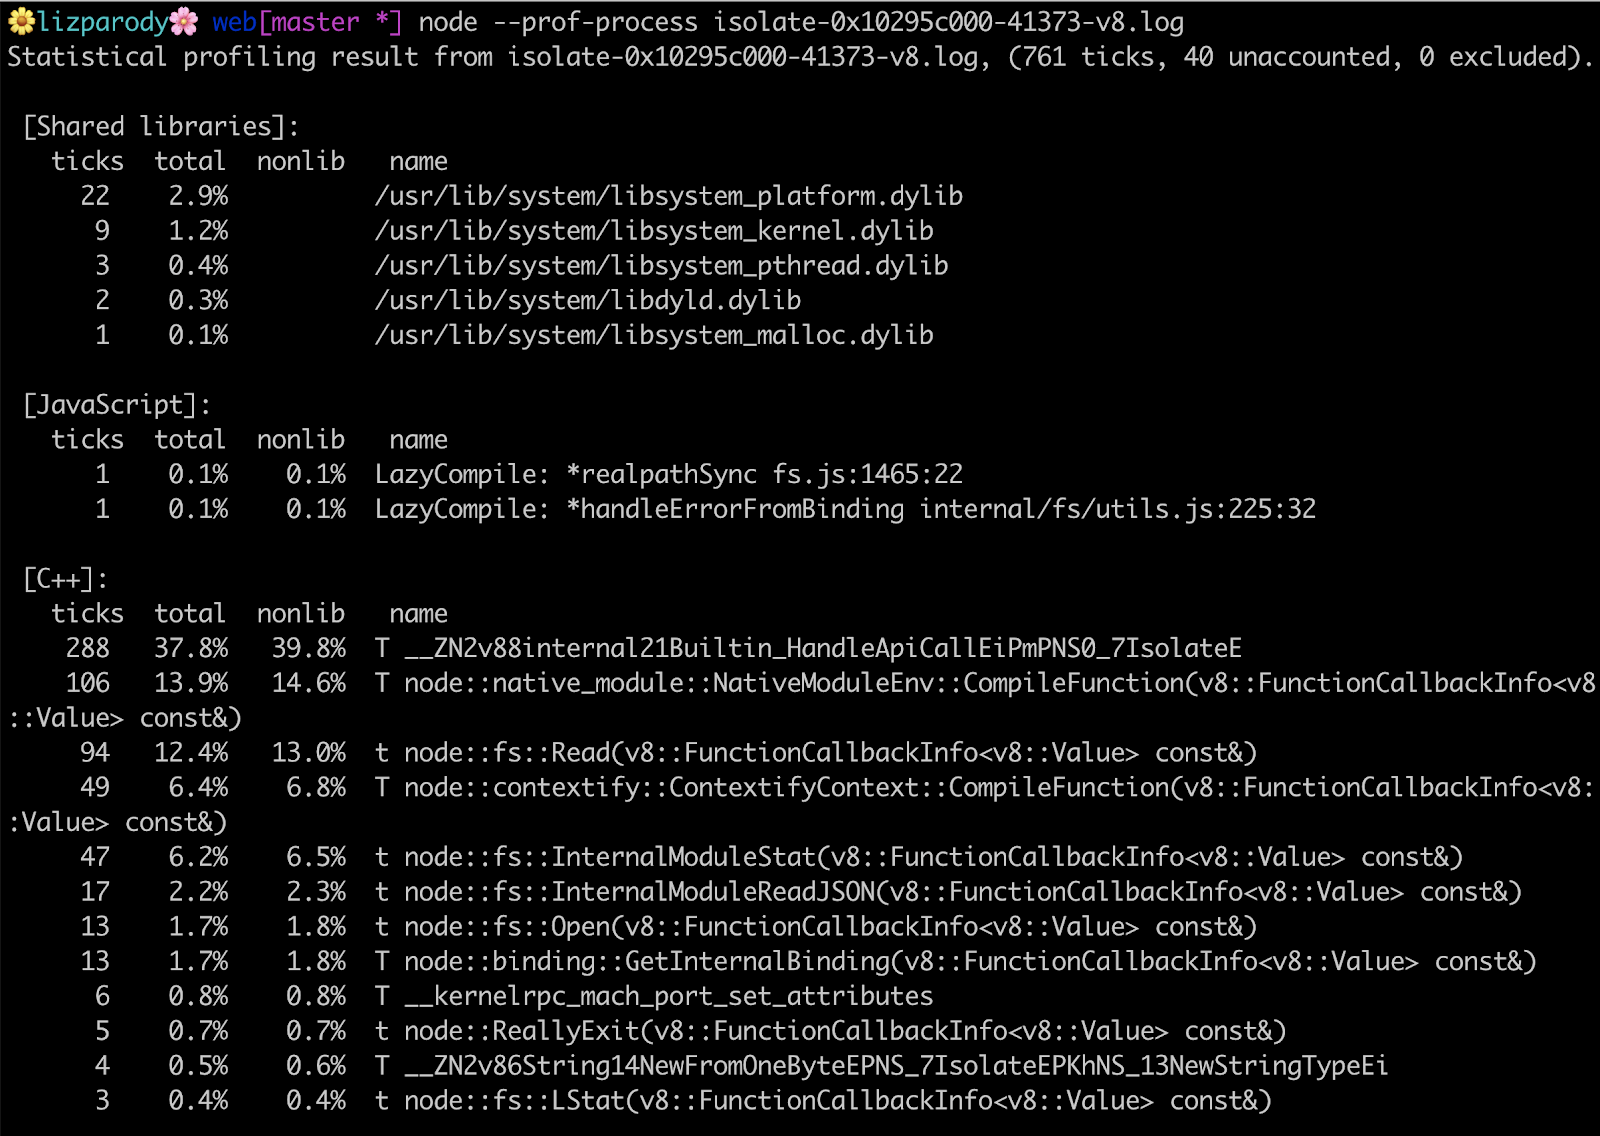
There are a lot of things going on here, but what this is basically showing is where you are spending time in shared libraries, JavaScript and C++ code.

The first line is saying that the application has used 761 ticks to execute the application. A tick is like a clock cycle used by a node process. So in theory the application took 761 clock cycles to execute. You can also find a summary section breaking down JavaScript vs C++ code.
It should be noted that in the [JavaScript] section you can see something called LazyCompile and ‘*realpathSync’. The asterisk means that V8 was able to optimize your code, so if you don’t see the asterisk there is a chance that your code is not optimized and is taking more time to execute than you realize.
The V8 Inspector
A few years ago, Chrome DevTools was integrated directly into V8, expanding its capabilities to include Node.js applications. With this integration it was possible to access step-debuggers without having to install the node-inspector module.
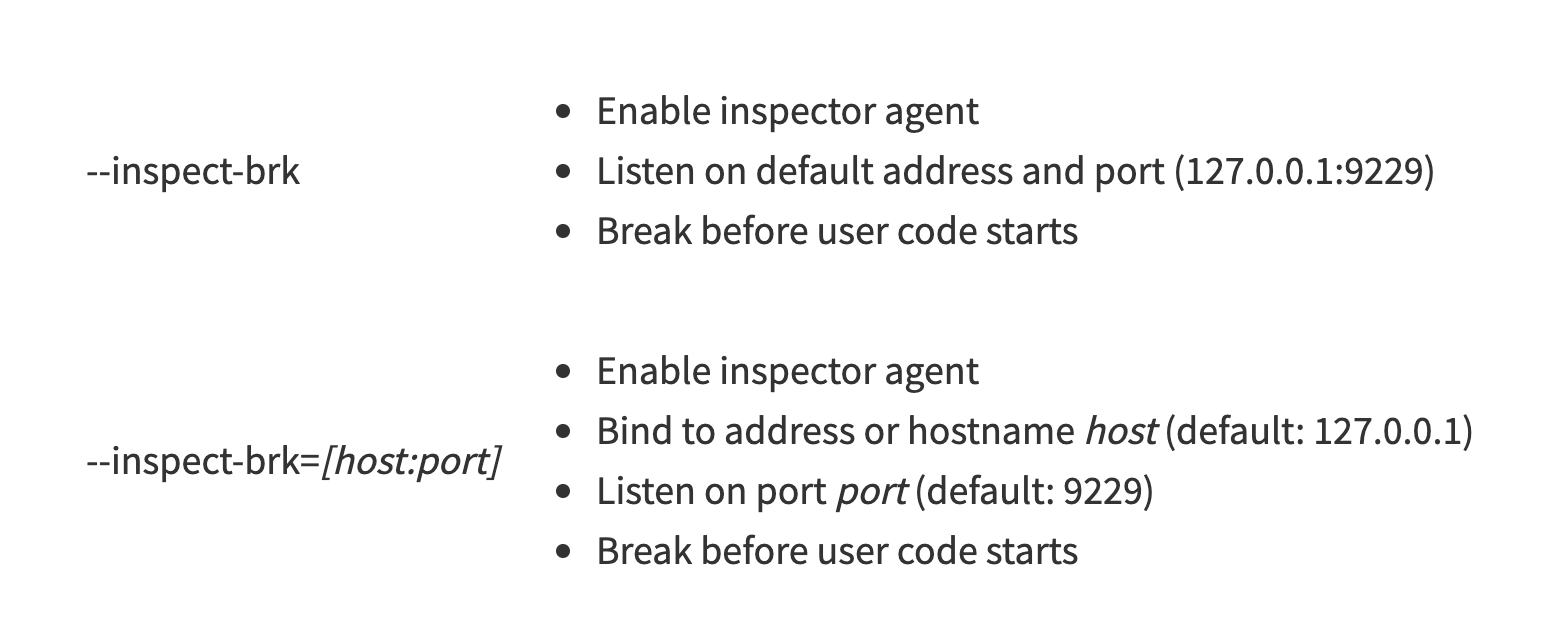
There are a few ways to get started: one is using the --inspect flag, which will start the inspector. Then, you can pass a host and a port that you want to listen to which you will connect later --inspect[=[host:]port]. If no parameters are passed, it will connect to 127.0.0.1:9229 by default.
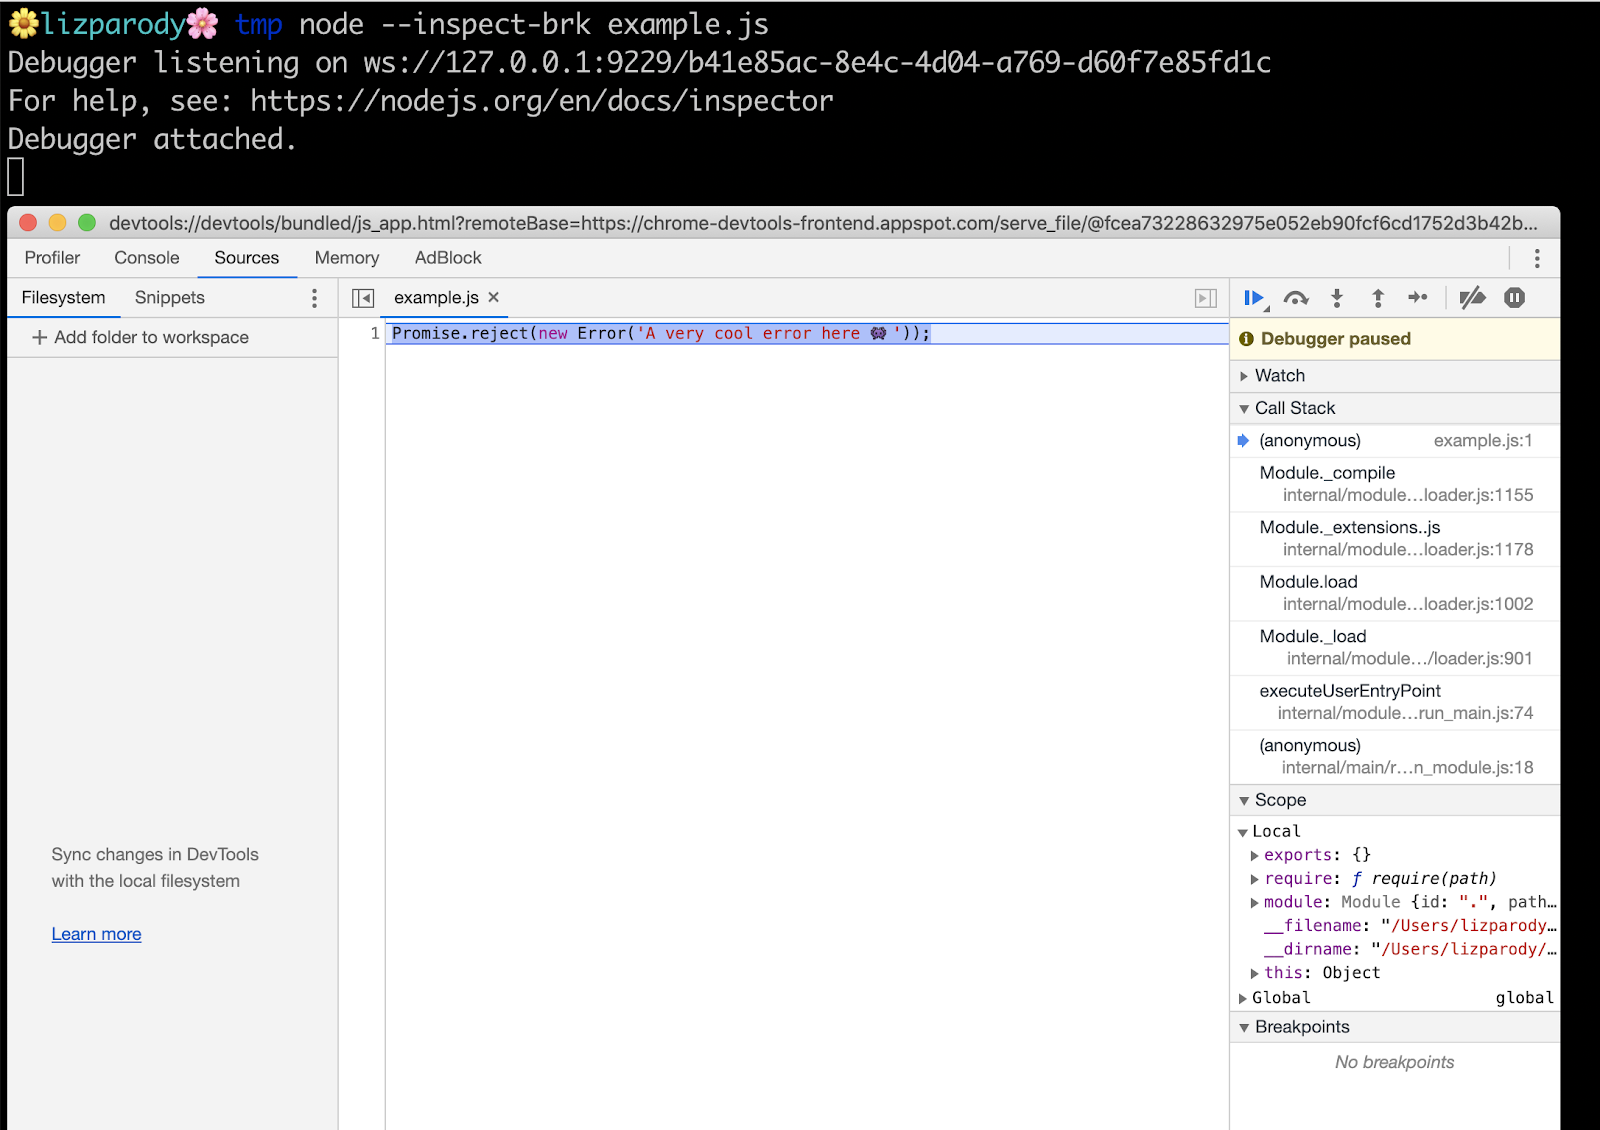
One other way is more useful when doing local development, using the --inspect-brk flag . This flag has the same options for host and port than the --inspect flag but also puts a breakpoint before the user-code starts, so you can do any type of setup you prefer without having to try/catch break points in your code at runtime.
In the example file, there is this line of code: Promise.reject(new Error('A very cool error here 👾'));
Now calling the file with the --inspect-brk flag
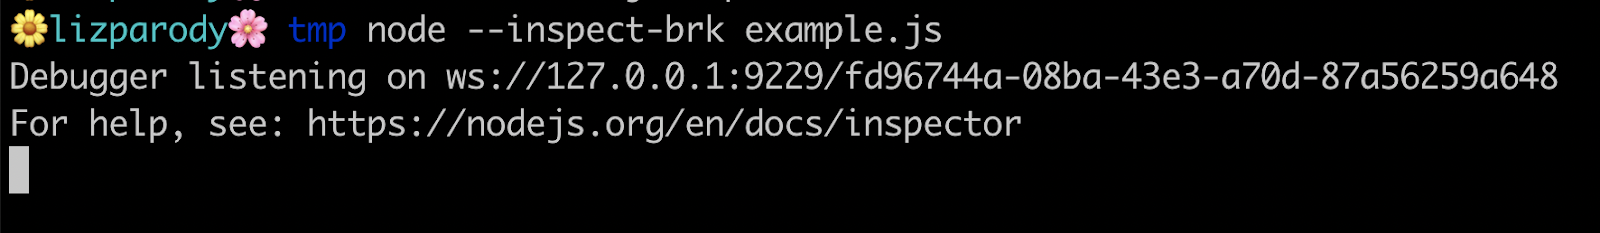
We can see the message printed in the console: Debugger is listening on ws: followed by a websocket url. Websocket makes it possible to open a two-way interactive communication session between the user's browser and a server. We can also see a message that directs users to the Node.js documentation so we understand what is happening there.
Then, if we go to the url chrome://inspect or even better about:inspect, you will see something like this:
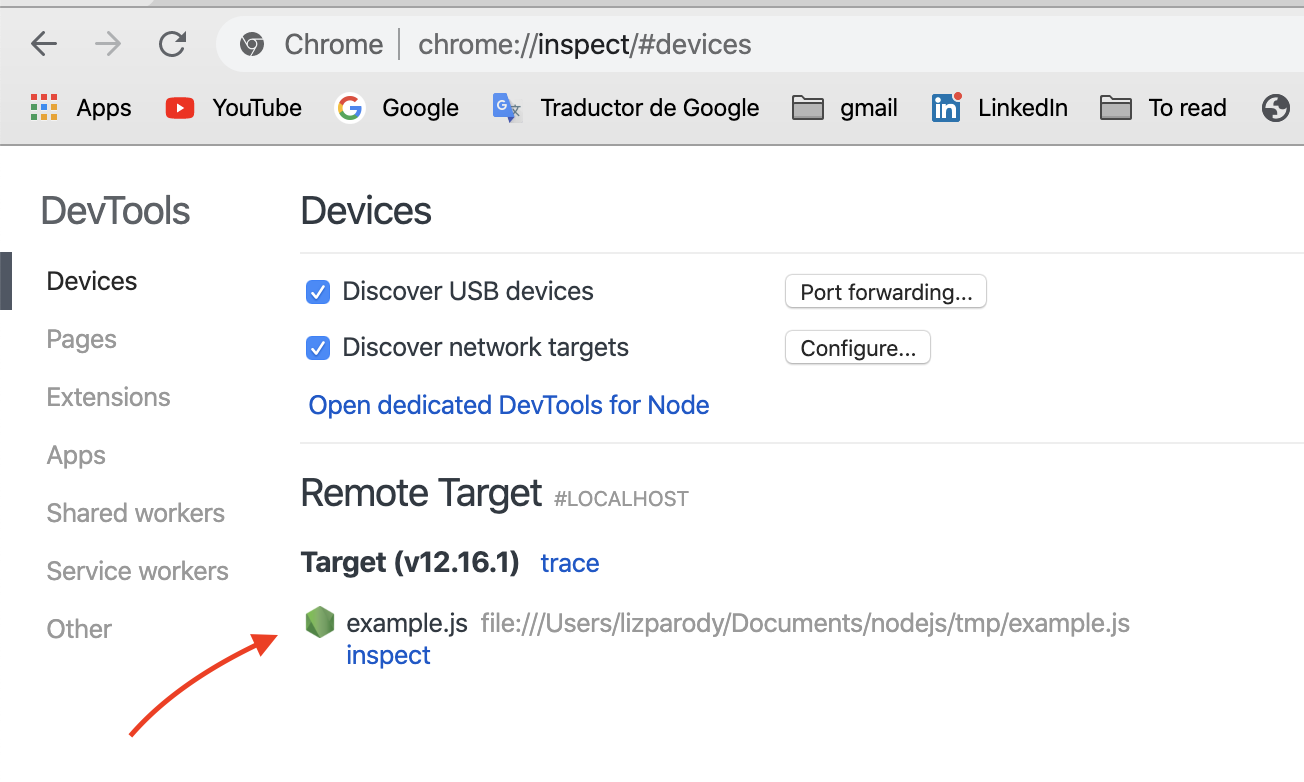
Once you click on the dedicated DevTools for Node.js link, you can see a popup window for debugging your Node.js session.
One cool feature is that when you kill and restart node, the window will automatically reconnect to it. 🔁
DevTools is now connected to Node.js, providing you with access to all the Chrome DevTools features you’re used to. This allows you to:
- Edit pages on-the-fly and diagnose problems quickly, which ultimately helps you build better websites, faster.
- Complete breakpoint debugging, stepping with blackboxing
- Access sourcemaps for transpiled code
- LiveEdit: JavaScript hot-swap evaluation with V8
- Console evaluation with ES6 feature/object support and custom object formatting
- Sampling JavaScript profiler with flamegraph
- Heap snapshot inspection, heap allocation timeline, allocation profiling
- Asynchronous stacks for native promises
However, the V8 Inspector should never be used in production because DevTools actions halt the event. This is acceptable in development, but unsuitable for production environments. If you are interested in production diagnostics: NodeSource's Node.JS for Enterprise (NSolid) is the only way to access native performance and security metrics and diagnostics that don’t incur latency in production.
The V8 inspector is super useful in development and NSolid in production environment and you should give it a try! 😉
CPU Profiling - in Dev and Prod
CPU Profiling - in Dev only
CPU Profiling allows you to understand where opportunities exist to improve the speed and load capacity of your Node processes.
One common problem inside DevTools is getting your server set up and running and then trying to start a CPU profiling session. This is problematic because when you try to kill your server and you are applying load the profiling may not work properly.
To solve that issue, the --cpu-prof flag was built directly into Node.js. This flag will start the CPU profiler and when the Node.js process exits it will write a CPU profile output to a file.
You can also use the --cpu-prof-dir flag to specify a directory where the file will be saved and --cpu-prof-name to change the name of the file. If you don’t specify those attributes, the file will be saved in your present working directory, and the name will be a combination of the date, PID, TID, sequence and will end with cpuprofile keyword.
CPU.${yyyymmdd}.${hhmmss}.${pid}.${tid}.${seq}.cpuprofile
You can also set the --cpu-prof-interval flag which is how often the sample profiler is going to sample your application. By default this is set to one millisecond. You can also use the DevTools UI to collect profiles by hand.
In other words, the --cpu-prof flag will start the V8 CPU profiler on start up, and write the CPU profile to disk before exit. If --cpu-prof-dir is not specified, the profile will be written to the current working directory with a generated file name.
This is how a cpu profile looks like:
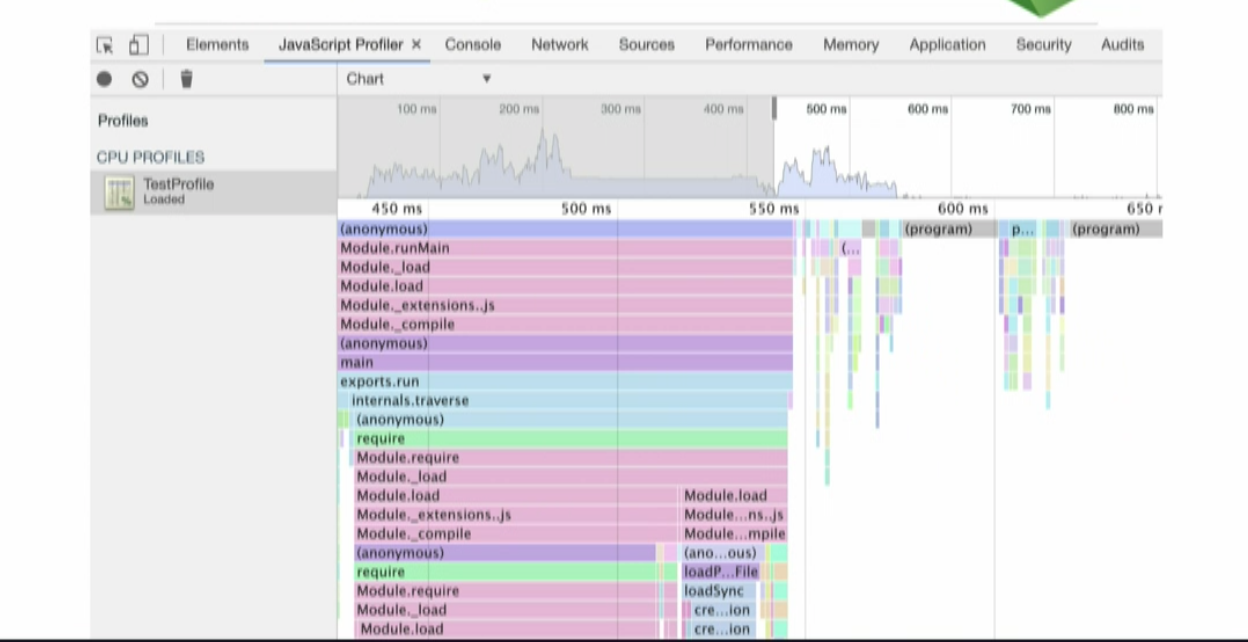
The top section is showing you a high-level view about the CPU activity over time. You can select an interva linside and that will show a more detailed breakdown of the activity.
CPU Profiling measures the space (memory) or time complexity of a program, the usage of particular instructions, or the frequency and duration of function calls. Most commonly, profiling information serves to aid program optimization.
CPU Profiling - in Prod only
In a production environment, we recommended using NSolid. It has some benefits over Chrome Dev Tools, including:
- It’s possible to use it in development and production.
- There is no computational overhead which means that results are consistent without incurring an observer effect that can skew results.
- It is a drop and replace version of the Node.js runtime, requiring zero code instrumentation.
- It doesn't stop the event-loop, and was specifically designed to be useful in production environments.
- It can be configured to automatically trigger CPU profiles if a process exceeds a certain performance threshold.
For analyzing profiles using the NSolid Console, first you launch the console and select the process that is of interest.
On the process details page, click the New CPU Profile button, then you select your profile window (5 to 60 seconds) and desired visualization style and run profile.
You can choose between three different visualizations: Sunburst Chart, Flame Graph, and Tree Map. The next images is an example of a Sunburst Chart:
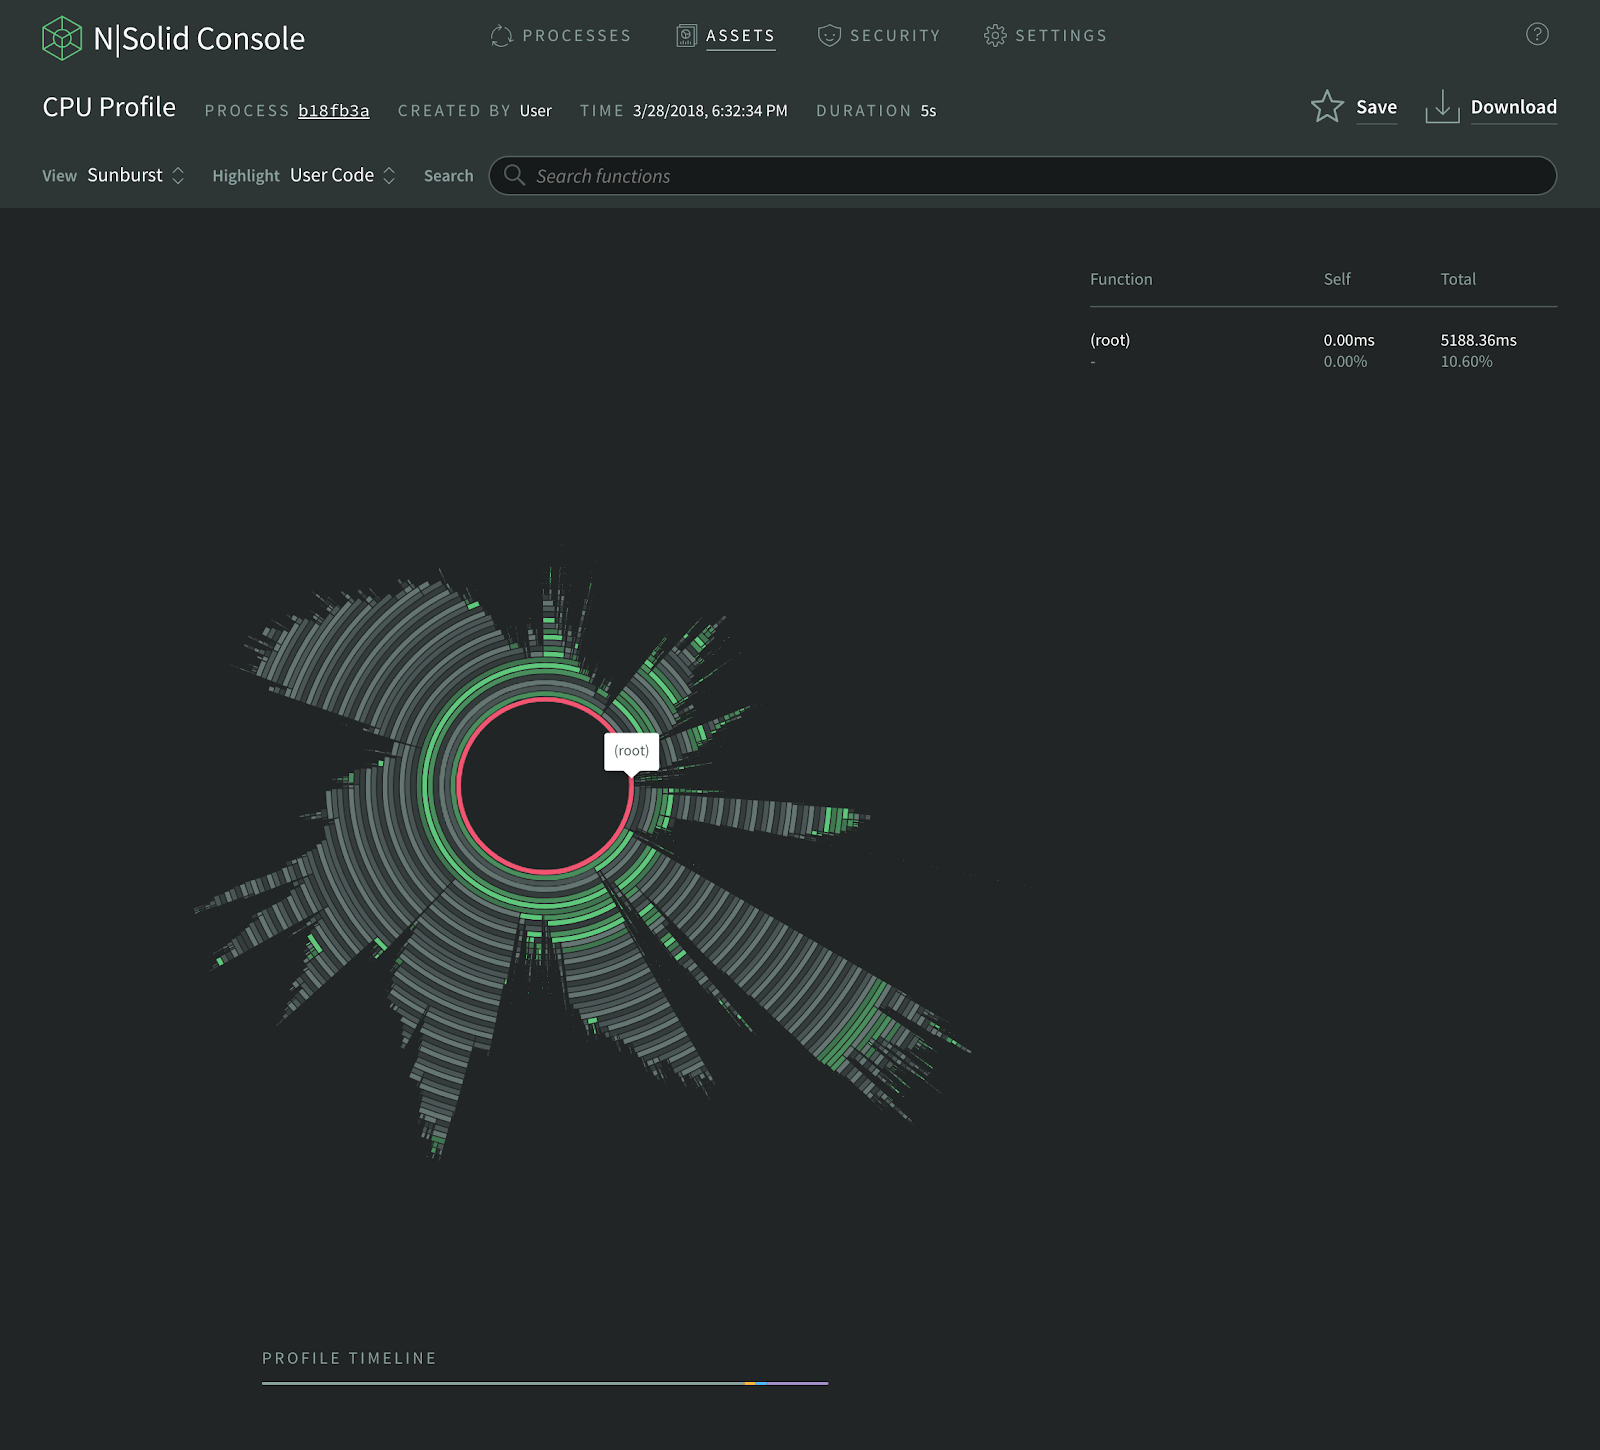
To find out more about cpu profiling in NSolid visit the docs here
Heap Snapshots - in Dev and Prod
Heap Snapshots - in Dev only
A heap snapshot is a static snapshot of memory-usage-details at a moment in time, and it provides a glimpse into the heap usage of V8, the JavaScript runtime that powers Node.js. By looking at these snapshots, you can begin to understand where and how memory is being used. Heap snapshots are very useful for finding and fixing memory and performance issues in Node.js applications, especially memory leaks.
A few years ago, developers had to use the heap dump module to obtain heap snapshots. Today, we have a built-in heap snapshots signal flag --heapsnapshot-signal so you can send as many signals as you want and Node.js will dump the heap snapshots.
Chrome DevTools allows you to compare snapshots, and you can identify objects in memory that will help you narrow down where a memory leak might be occurring.
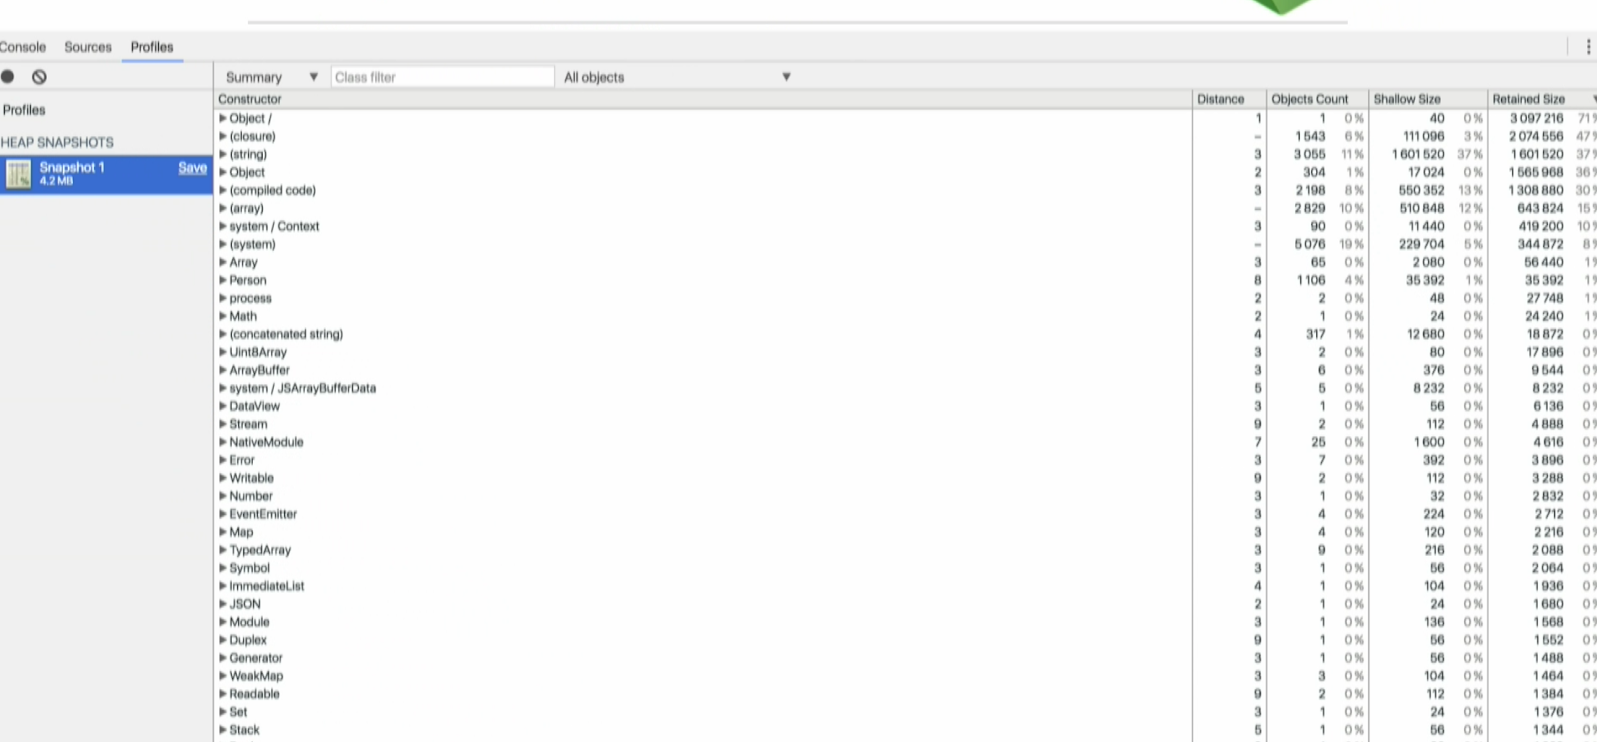
This is how a heap snapshot looks like in Chrome DevTools at a very high level. The column on the far left lists the objects on the JavaScript heap.
On the far right, you can see:
the Objects count column which represents how many objects are in memory,
the shallow size column, which is the amount of memory allocated to store the object itself, not taking into account the referenced objects, and
theretained size column which is its shallow size plus the shallow sizes of the objects that are accessible, directly or indirectly, only from this object.In other words, the retained size represents the amount of memory that will be freed by the garbage collector when this object is collected.
In this example, we can see that the selected object is holding on to over 3 GB of ram and 3 MB of memory. This object should be reviewed.
Heap Snapshots - in Prod only
The best solution to get heap snapshots in production is the NSolid console. The benefits of NSolid over Chrome DevTools include the possibility to use it in development and production, as well as providing a live instrumentation of your production system's health, and stability with no changes to your application code and no computational overhead.
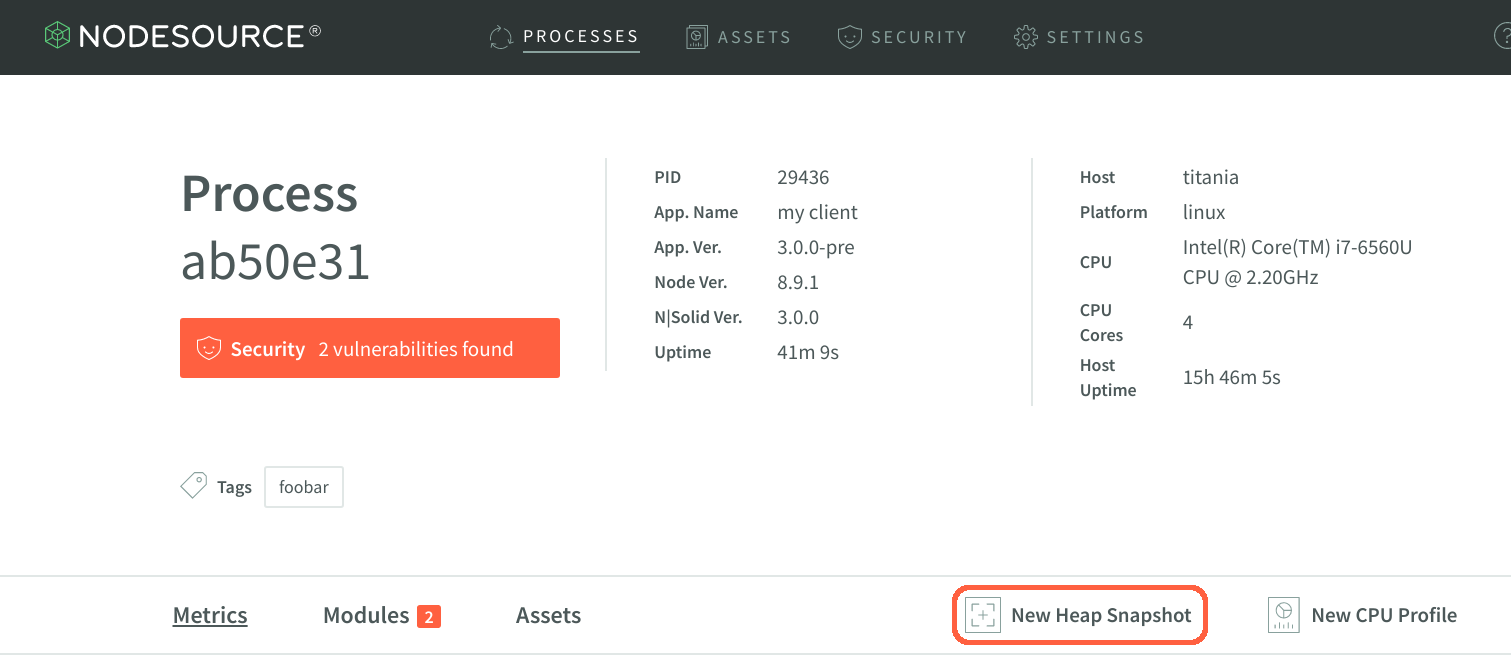
To use NSolid’s Heap Snapshots, first launch the console and locate the Processes list on the right, choose the process ID of interest and click New Heap Snapshot from the Process Detail view as is shown in the image below.
Now that you can see the results of the heap snapshot, navigate through the various objects indexed during the snapshot process.
You can also configure the NSolid Console to automatically take Heap Snapshots when any process exceeds a certain performance threshold (i.e. Memory > 700MB).
Once taken snapshots can be easily compared as is shown in the image below. This is especially useful to compare an application’s heap-snapshot that was taken when a performance problem occurred against itself when it was still running smoothly.
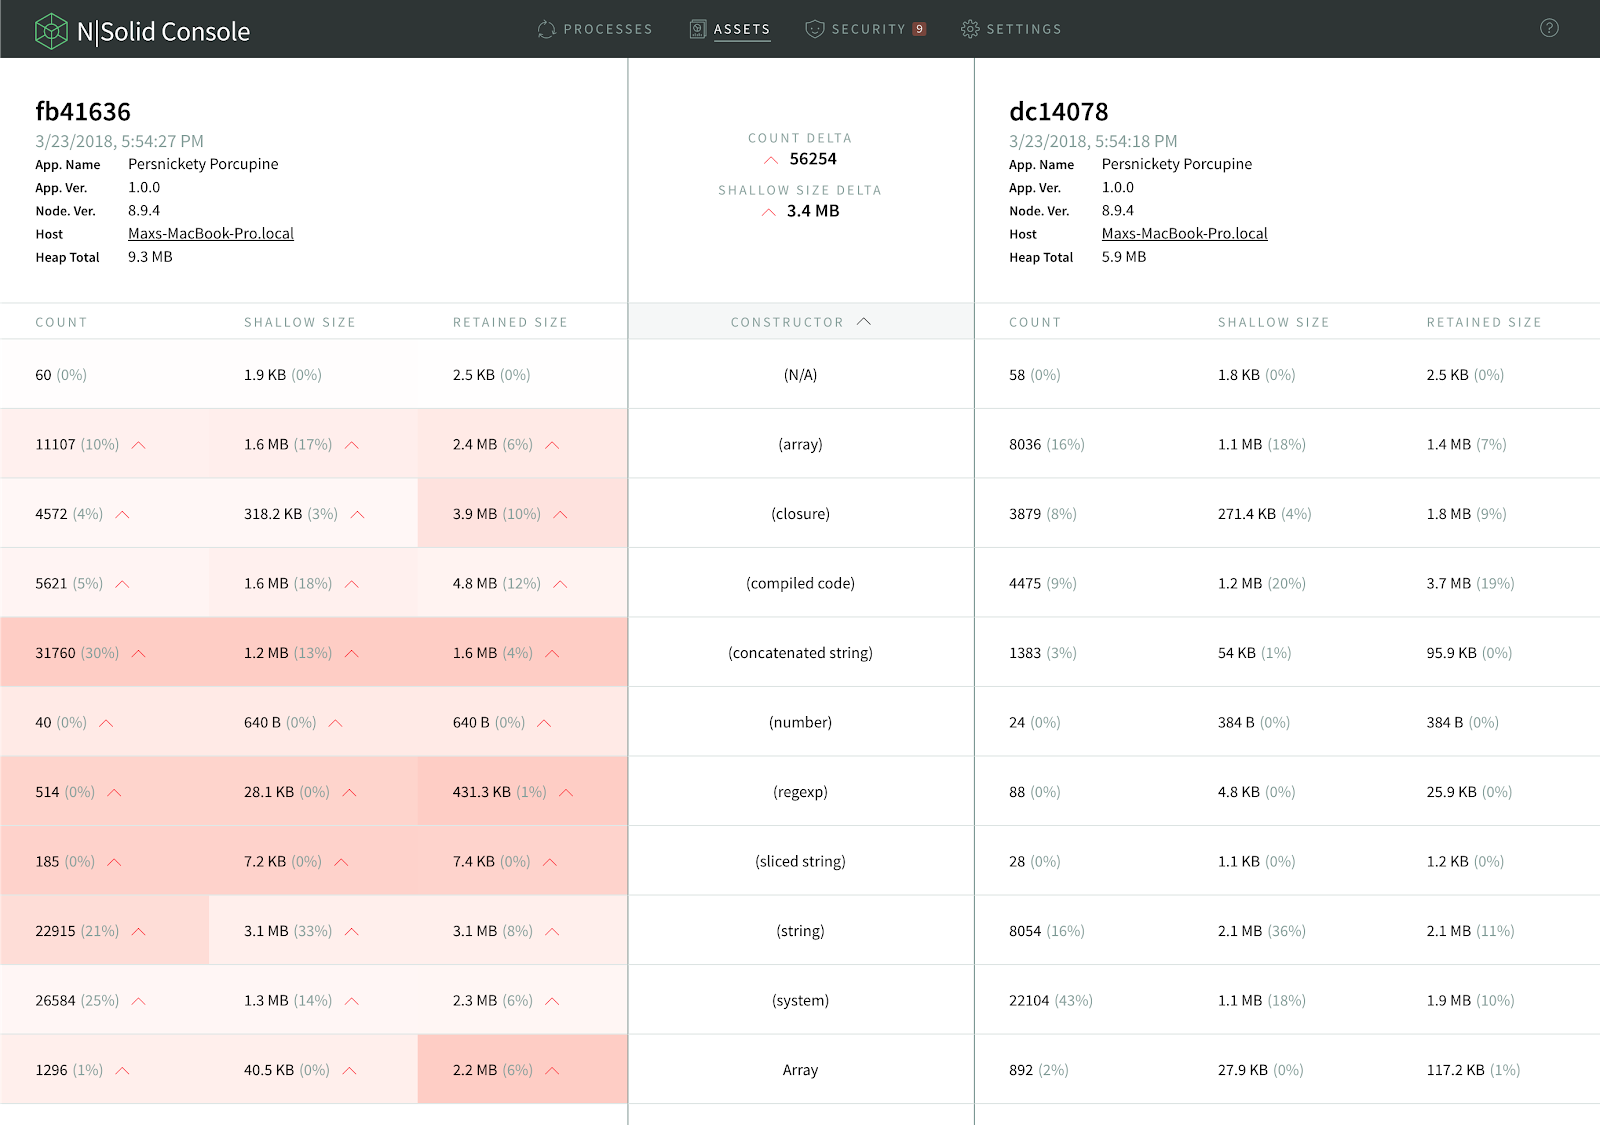
Cells on the left-hand snapshot will be colored, reflecting the percentage difference within the row. The redder the cell, the greater the value has increased over the corresponding value in the other snapshot. Greener cells indicate the reverse. This will help you find memory leaks or performance issues more easily, which can help you to identify the underlying problem faster.
You can find more information here.
Asynchronous Stack Traces
Async Stack Traces make debugging async functions easier. These are rich stack traces that not only include the current synchronous part of the stack, but also the asynchronous part.
Normally, when you execute asynchronous operations, the stack trace is not completed because it doesn’t show the asynchronous part. This makes debugging way more difficult, because you can see that there is an error but you don’t know where it originated from.
There is a very popular module called longjohn that is used for this. However, this module comes with a lot of performance overhead, so it is not recommended to use it in production.
Because of that the V8 team added Async Stack Traces as a way to work with async/await code with very low cost. This will show you where the asynchronous operations happen.
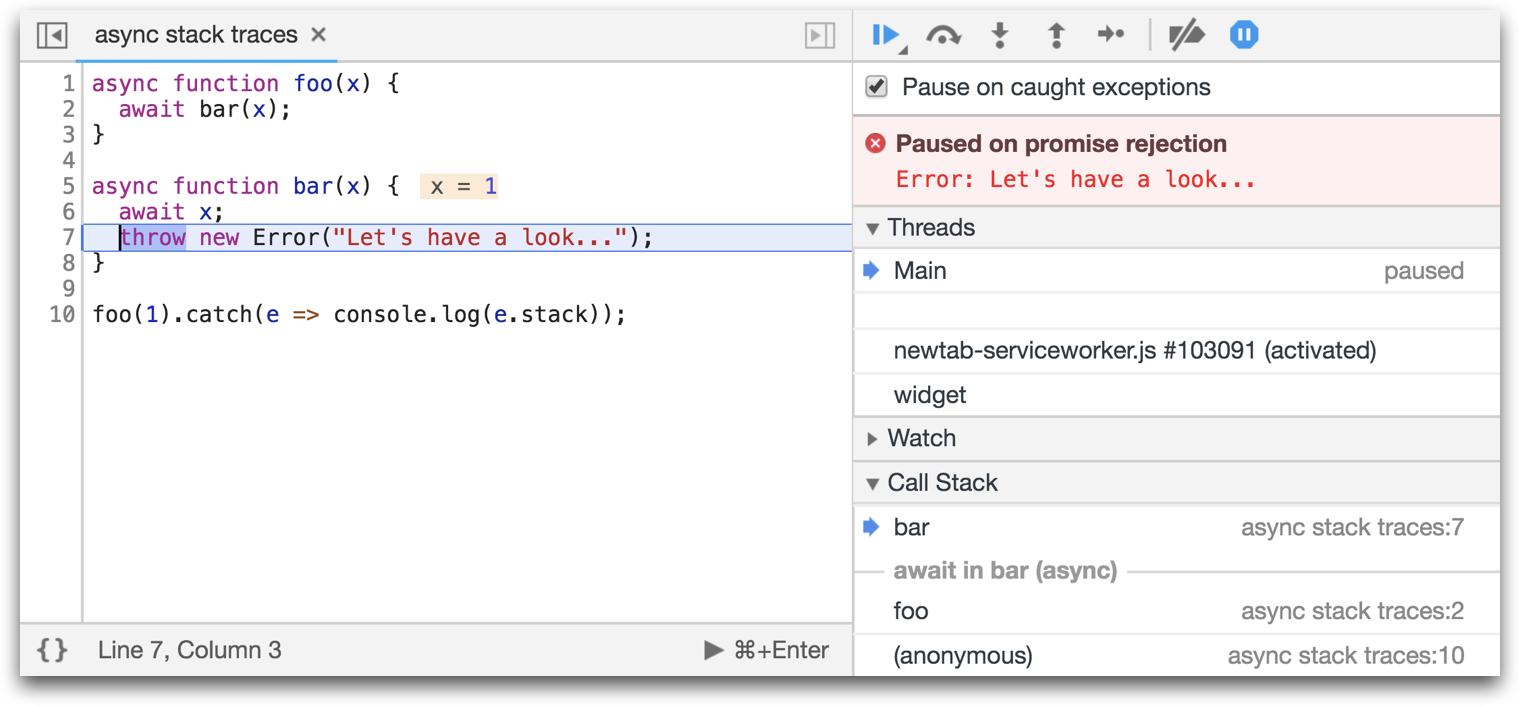
As an example, here we have a function called foo, which is executing an asynchronous operation calling the function bar.
Normally, you will only be able to see bar in the stack trace, but with the Async Stack Trace you can now see foo in the DevTools as well.
References:
Profiling Node.js Code ( Part 1: Basics )
Debugging Guide - Node.js Docs
The WebSocket API (WebSockets)
Debugging Node.js with Chrome DevTools
Read More
A diagnostic is a practice concerned with determining a particular problem using a combination of data and information.
The same concept can be applied to Node.js.
When there is a bug, diagnostics utilities can help developers identify the root cause of any Node.js application anomaly whether it occurs in development or production.
There are many types of issues a Node.js application can run into. This includes: crashing, slow performance, memory leaks, high CPU usage, unexpected errors, incorrect output, and more. Identifying their root cause is the first step towards fixing them.
While diagnostics in Node.js doesn’t point to the exact problem or specific fixes, it contains very valuable data that hints about the issue and accelerates the diagnostic process.
This is a 3-part blog series on Node.js. It is based on Colin Ihrig's talk at JSConf Colombia. The topics are separated by the age of diagnostic techniques, from the oldest to the newest:
- Part One: Debug Environment Variables, Warnings, Deprecations, Identifying Synchronous I/O and Unhandled Promise Rejections.
- Part Two: Tick Processor Profiling, The V8 Inspector, CPU Profiling, Heap Snapshots, Asynchronous Stack Traces.
- Part Three: Tracing, TLS Connection Tracing, Code Coverage, Postmortem Debugging, Diagnostics Reports.
Let’s begin!
A Little bit of History:
In the early years of Node.js it used to be very hard to get diagnostic-information. Node.js was built with a “small core” philosophy, meaning that the core of the project was aimed to remain as small as possible.
It was very important that the Node.js core worked properly, and non-essential things like diagnostics were pushed out into the npm ecosystem (since Node.js can still work just fine without diagnostics). This left us with npm modules such as node inspector node-heapdump, longjohn and others. This dynamic slowed the process of incorporating diagnostic tooling into Node.js itself .
As Node.js matured and as more and more enterprises continued to adopt Node.js, the maintainers realized that diagnostic capabilities were a necessity. These needed to be built into the project, so in the last few years a lot of work has been done to make this a reality. Instead of having to npm install
Debug Environment Variables
One of the oldest diagnostic mechanisms built into Node.js are Debug Environment Variables. There are two environment variables you can use to print out useful information from Node.js either in the JavaScript layer or in the C++ layer. Those variables are:
NODE_DEBUGfor JavaScript loggingNODE_DEBUG_NATIVEfor C++ logging
All you have to do as you start your Node.js process, is to pass a comma separated list of all subsystems that you would like to have extra diagnostic information from.
Let's takeNODE_DEBUG as an example: imagine you have a deeply nested filesystem call and you have forgotten to use a callback. For example, the following example will throw an exception:
const fs = require('fs');

function deeplyNested() {
  fs.readFile('/');
}

deeplyNested();
The stack trace shows only a limited amount of detail about the exception, and it doesn’t include full information on the call site where the exception originated:
fs.js:60
    throw err;  // Forgot a callback but don't know where? Use NODE_DEBUG=fs
      ^

Error: EISDIR: illegal operation on a directory, read
    at Error (native)
Without this helpful comment, many programmers see a trace like this and blame Node.js for the unhelpful error message. But, as the comment points out, NODE_DEBUG=fs can be used to get more information on the fs module. Run this script instead:
NODE_DEBUG=fs node node-debug-example.js
Now you’ll see a more detailed trace that helps debug the issue:
fs.js:53
    throw backtrace;
        ^

Error: EISDIR: illegal operation on a directory, read
    at rethrow (fs.js:48:21)
    at maybeCallback (fs.js:66:42)
    at Object.fs.readFile (fs.js:227:18)
    at deeplyNested (node-debug-example.js:4:6)
    at Object.<anonymous> (node-debug-example.js:7:1)
    at Module._compile (module.js:435:26)
    at Object.Module._extensions..js (module.js:442:10)
    at Module.load (module.js:356:32)
    at Function.Module._load (module.js:311:12)
    at Function.Module.runMain (module.js:467:10)
Now with this information, it becomes easier to find the root cause of the problem. The problem was in our code, inside a function on a line 4 that was originally called from line 7. This makes debugging any code that uses core modules much easier, and it includes both the filesystem and network libraries such as Node’s HTTP client and server modules.
Using environment variables is a good way of debugging, without having to modify your code at all.
Handling Warnings
A few years ago, the concept of warnings was introduced into Node.js. A warning is just a message or notice that implies something that could go wrong (eg memory leak, unused variables) or something that might not work in the future (eg deprecation). Node.js logs warnings about potentially risky behaviors.
It is possible to turn the warnings off using the flag --no-warnings but this practice is not recommended. Instead you can redirect all the warning messages into a file with the flag --redirect-warnings=fileName. This is especially useful if you have a lot of warnings and don’t want to see them all in your console.
You can also use the flag --trace-warnings, which will give you the stack trace of where the warning is coming from whenever you encounter a warning.
The following is an example using buffers:
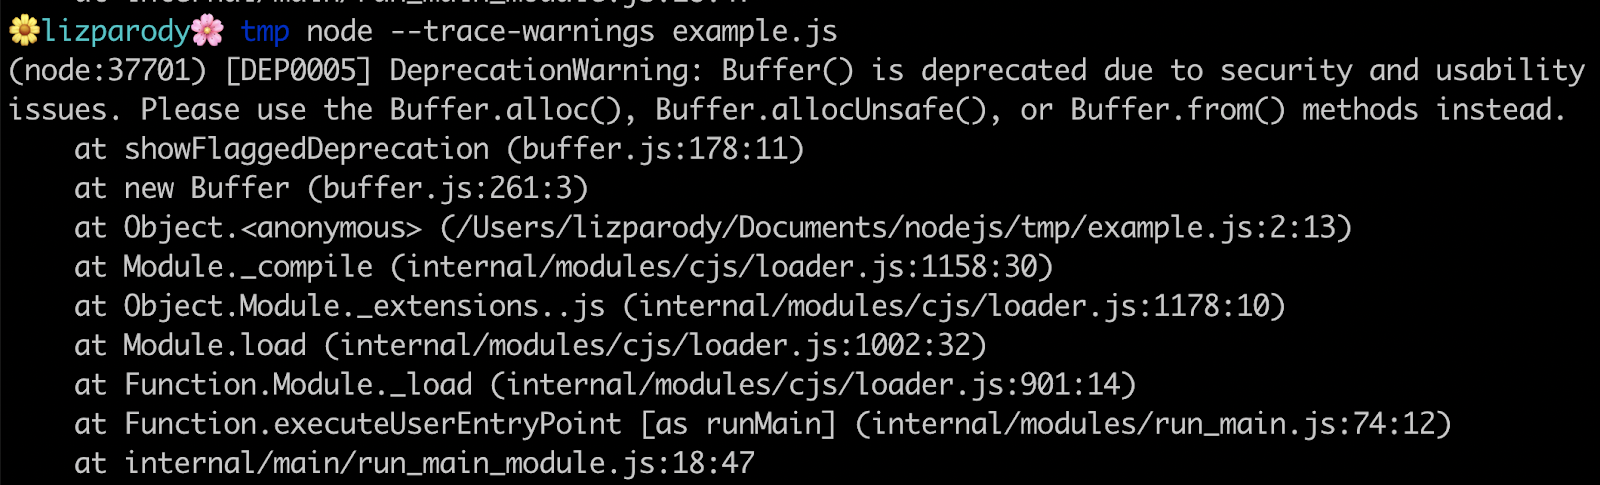
This warning is showing something that might not work in the future: a deprecation warning. It issues a recommendation to use another constructor method along with the stack trace of where that warning originated.
Handling Deprecations
Similar to warnings, there is a special class of warnings called Deprecations. These point out deprecated features that are recommended to not to be used in production because they will no longer be supported, which can cause problems.
There is also a flag that you can use to turn Deprecation warnings off; --no-deprecations. This will disable all Deprecation warnings, but is not recommended to use this flag.
The --trace-deprecation flag works similarly to trace warnings, printing a stack trace when deprecated features are used. The --throw-deprecations flag throws an exception if and when deprecated features are used, so instead of issuing a warning it will throw an error. Its use is recommendedin development rather than in production.
Using the same example of Buffer() we can see this:
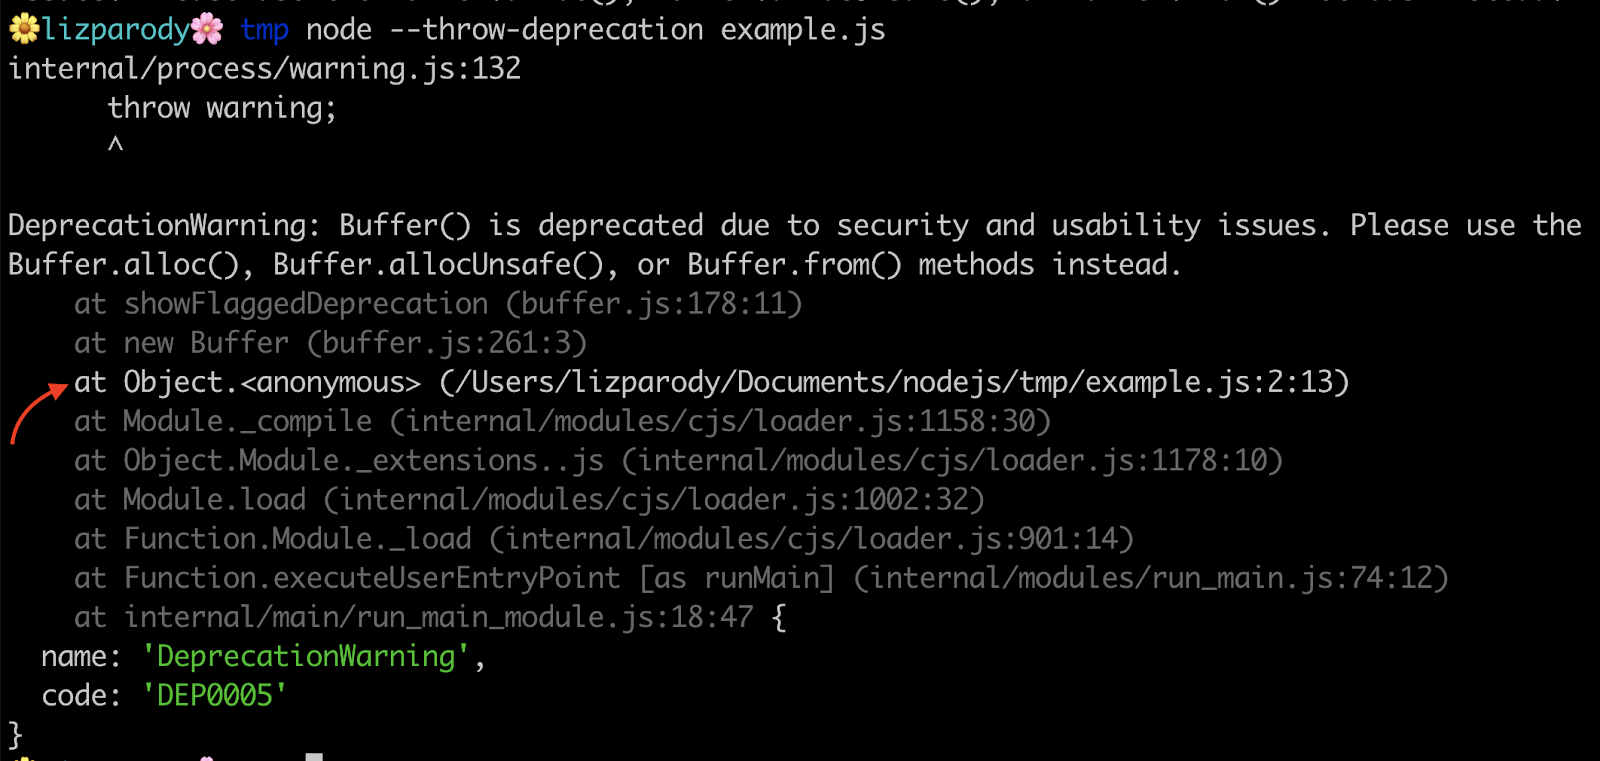
The --throw-deprecation flag shows you where the code is coming from. One cool thing about this is that the stack frames are shown in different colors. In Node.js v.12, the line with the error is in white while the rest of the stack trace is in gray, pointing to the exact part of your code that should be changed.
Identifying Synchronous I/O
One common way to introduce performance problems in your code is by using Synchronous I/O. If you are working on a server-side application, it is possible to have an initialization period when the server starts up but can’t yet listen to the server’s traffic. Once you start serving the request, it is very important to not block the event loop because that could cause the application to crash.
To avoid this, you can use the --trace-sync-io flag, which will show you warnings with stack traces of where you are using synchronous I/O, so you can fix it.
The following intends to provide an example: The file called example.js contains the following line of code:
setImmediate(() => require('fs').readFileSync(__filename)).
When running the file using the flag --trace-sync-io we can see this:
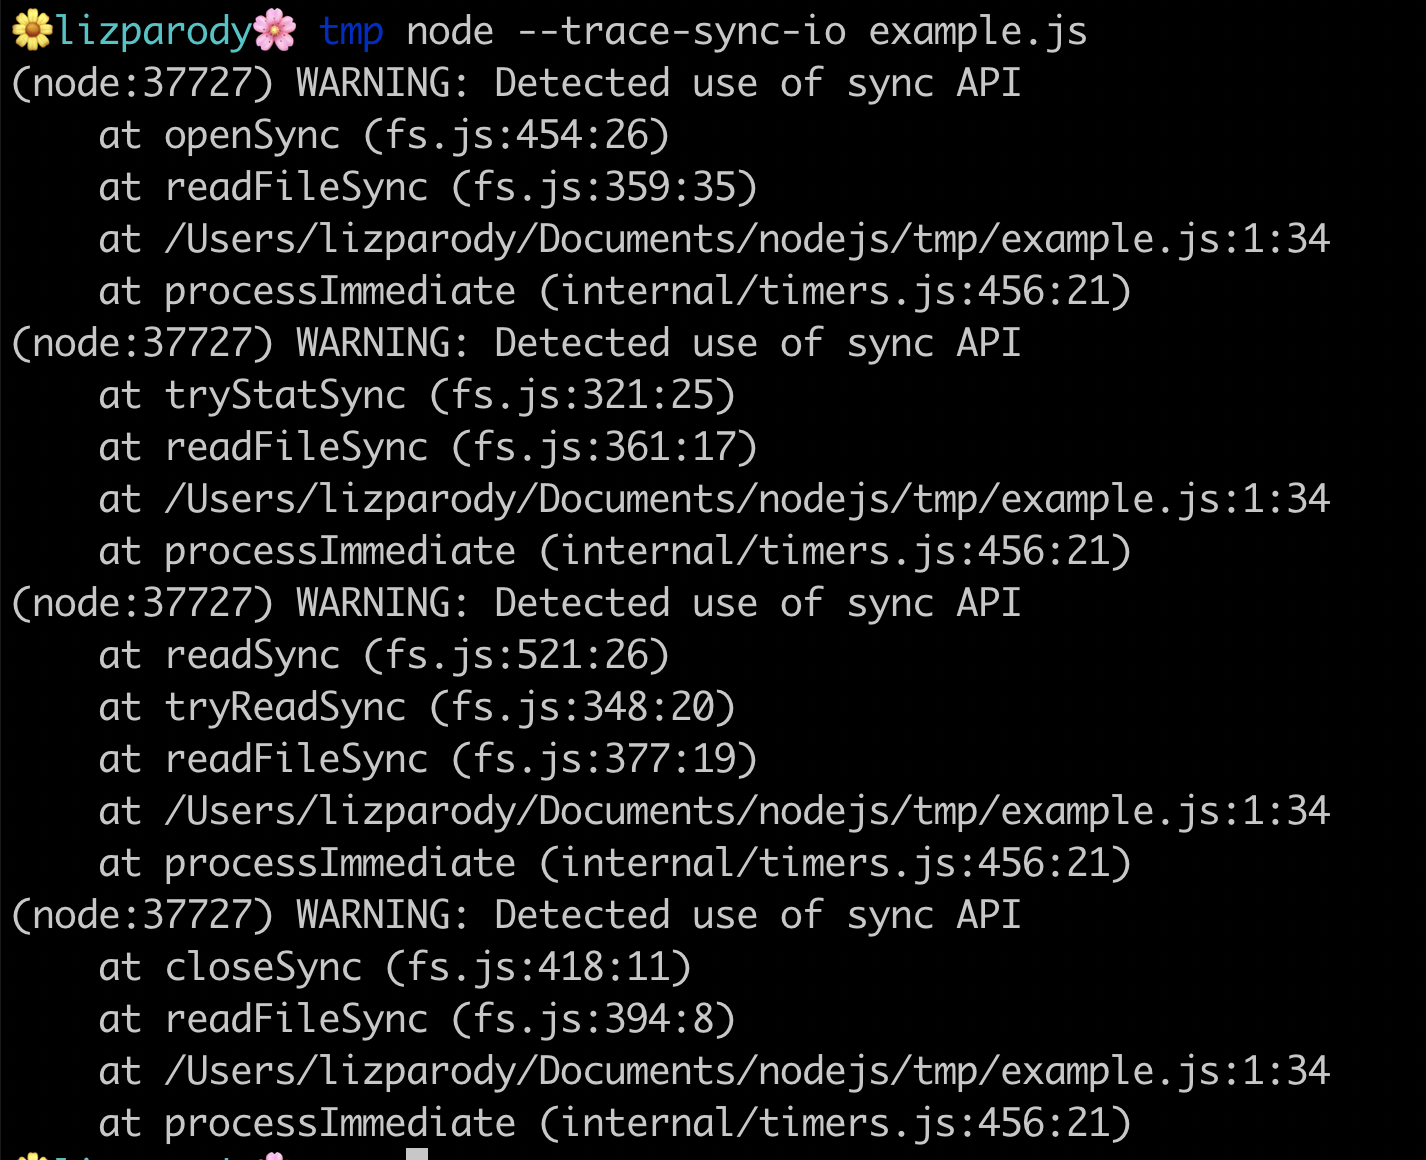
The example uses readFileSync, to read the file.
If setImmediate was not around it, there wouldn’t be any problem because it will read the file in the first event loop tick. But since setImmediate is being used, the file read is deferred until the next tick and that’s where synchronous I/O is happening. readFileSync not only reads the file, it opens the file, does a stack call, reads the file and then closes it. As such, having synchronous I/O operations should be avoided.
Unhandled Promise Rejections
You might have probably seen a message like this when working with promises: UnhandledPromiseRejectionWarning: Unhandled promise rejection. This error originated either by throwing inside of an async function without a catch block, or by rejecting a promise which was not handled with .catch().
A promise is a state representation of an asynchronous operation and can be in one of 3 states:
- "pending"
- "fulfilled"
- or "rejected"
A rejected promise represents an asynchronous operation that failed for some reason and is completed with .reject(). Another reason could be an exception that was thrown in an async executed code and no .catch() did handle the rejection.
A rejected promise is like an exception that bubbles up towards the application entry point and causes the root error handler to produce that output.
Unhandled Promise Rejections is a newer feature that came up in Node.js 12. Not handling promise rejections is an accepted practice in browsers, but in servers it could be problematic because it can cause memory leaks.
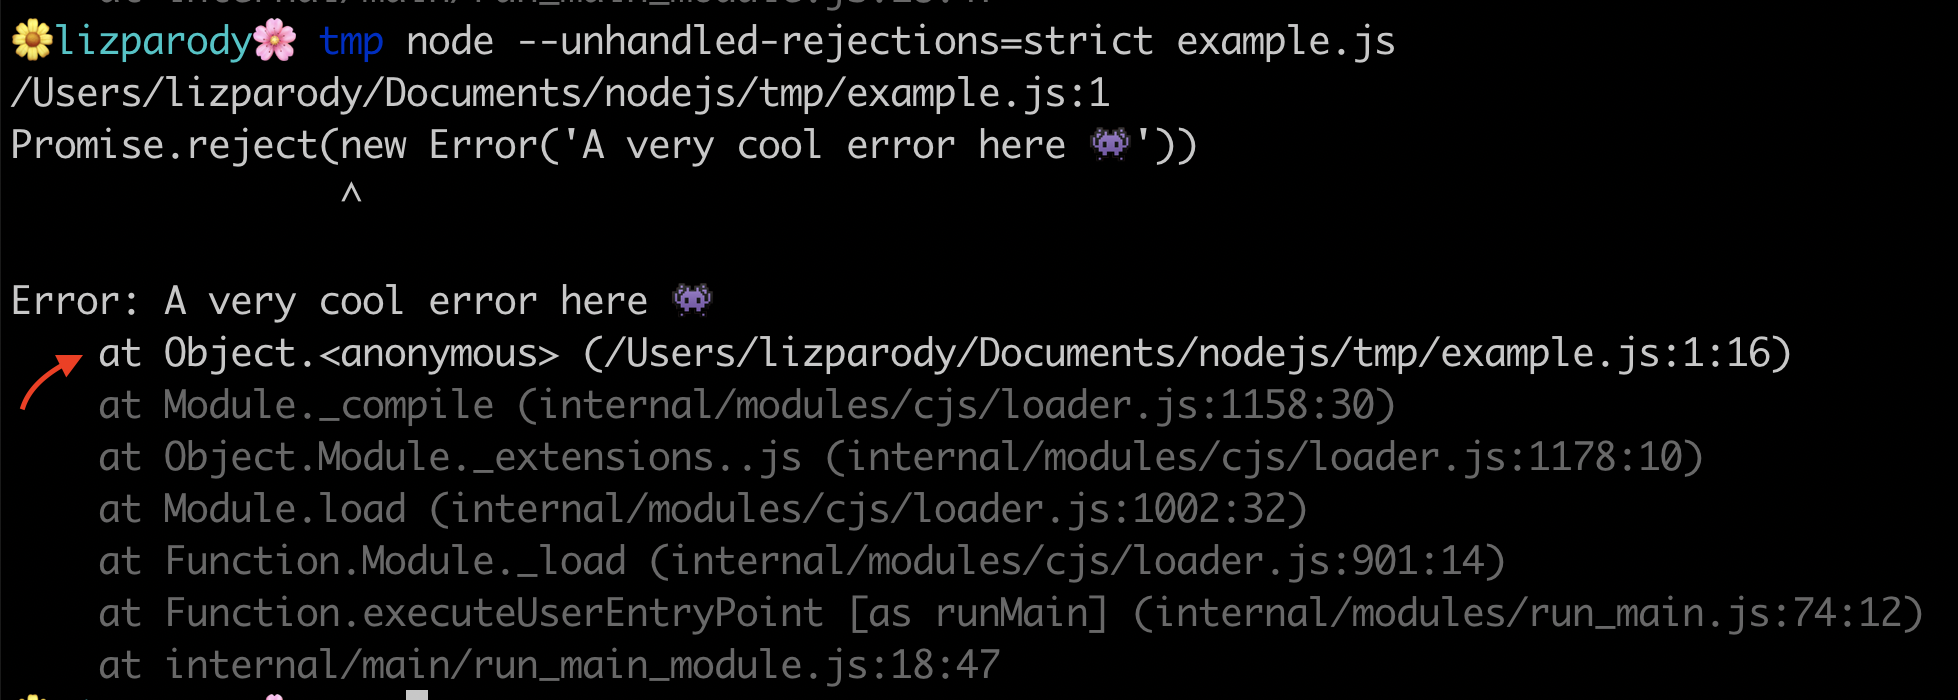
To avoid this, you can now use the flag --unhandled-rejections that has 3 modes of operations:
strictmode causes an uncaught exceptionwarnmode causes a warningnonemode swallows unhandled rejections (default standard)
In this example, Promise.reject is being called and passes a new error object. We use the flag --unhandled-rejections=strict from the command line, and this will throw an uncaught exception. A good reason to use the strict mode is because you can integrate your promises with your existing unhandled rejections workflow if you have one.
So in conclusion: we learned a little bit about the history of diagnostics in Node.js, why they are important and we analyzed five handy methods of using diagnostics in Node.js. This included useful flags, such as:
Stay tuned for part 2!
References
Testing and Debugging Node Applications
Unhandled Promise Rejections in Node.js
Debugging tools and practices in node.js
Read More

Node.js was first introduced 10 years ago, and in that period of time, has become the fastest-growing open source project on Earth, with +59,000 stars on GitHub and more than a billion downloads.
Part of the reason for the rapid growth in popularity was that Node.js allows developers use the same language for both the client-side and the server-side part of an application: JavaScript.
Node.js is an open-source and cross-platform JavaScript runtime environment designed for building scalable server-side network applications, and it’s a popular tool for almost any kind of project! Because of its exponential growth and popularity, many frameworks were created to enhance productivity, scalability, the speed of applications, to facilitate quick prototyping, and to automate processes with the help of libraries, templates, and reusable components.
In this article, we will explore the differences between three of the most popular frameworks in Node.js: Express, Koa, and Hapi. In a future post, we will look into Next, Nuxt and Nest.
-
The comparison is based on:
- Popularity (GitHub Stars and npm downloads).
- Installation.
- Basic Hello World app.
- Advantages.
- Disadvantages.
- Performance.
- Security.
- Community involvement.
Express
Express is a minimal and flexible Node.js web application framework that provides a robust set of features for web and mobile applications, it behaves like a middleware to help manage servers and routes.
Installation
For installing express, you need to have already installed Node.js. If you want to install express in a specific directory and save it in the dependencies list:
$ npm install express --save
However, if you want to install Express temporarily and not add it to the dependencies list, you can use:
$ npm install express --no-save
Hello World
This is the most basic example on how to create an express app that listens on port 3000 and responds “Hello World!”:
const express = require('express')
const app = express()
const port = 3000

app.get('/', (req, res) => res.send('Hello World!'))

app.listen(port, () => console.log(`Example app listening on port ${port}!`))
For every other path, the server will respond with 404 Not Found.
Advantages
- Almost the standard for Node.js web middleware.
- Simple, minimalistic, flexible and scalable.
- Fast app development.
- Fully customizable.
- Low learning curve.
- Easy integration of third-party services and middleware.
- Majorly focused on browsers, making templating and rendering an almost out of the box feature.
Disadvantages
Although Express.js is a very convenient and easy-to-use framework, it has some minor drawbacks that may influence the development process.
- Organization needs to be very clear to avoid problems when maintaining the code.
- As your codebase size increases, refactoring becomes very challenging.
- A lot of manual labor is required, since you need to create all endpoints.
Performance
Express provides a thin layer of fundamental web application features, without obscuring Node.js features that are familiar.
The best practices for improving express performance includes:
- Use gzip compression.
- Don’t use synchronous functions.
- Do logging correctly (for debugging, use a special module like debug, for app activity use winston or bunyan).
- Handle exceptions properly, using try-catch or promises.
- Ensure your app automatically restarts by using a process manager or use an
initsystem like systemd or upstart. - Run your app in a cluster. You can increase the performance of a Node.js app greatly by launching a cluster of processes (a cluster runs multiple instances of the app, distributing the load and tasks among the instances).
- Cache request results, so that your app does not repeat the operation to serve the same request repeatedly.
- Use a load balancer to run multiple instances of it and distribute the traffic, like Nginx or HAProxy.
- Use a reverse proxy that performs supporting operations on the requests. It can handle error pages, compression, caching, serving files, and load balancing among other things.
A simple “Hello World” app has the following performance request per second:
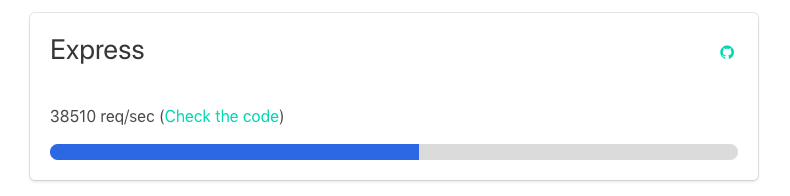
Security
You can find a list of security updates in Express in the following link. Node.js vulnerabilities directly affect Express, so is important to keep an eye on Node.js vulnerabilities and make sure you are using the latest stable version of Node.js.
Community involvement
The Express community meets regularly, and they communicate through their mailing list, Gitter, IRC channel, issues in GitHub, and the Express Wiki.
Finally, express is probably the most popular framework for Node.js, and there are many other popular frameworks that are built on Express.
Koa
Koa was built by the same team behind Express, and aims to be a smaller, more expressive, and more robust foundation for web applications and APIs. By leveraging async functions, Koa allows you to ditch callbacks and significantly increase error-handling. Koa does not bundle any middleware within its core, and it provides an elegant suite of methods that make writing servers fast and enjoyable.
A Koa application is an object containing an array of middleware functions which are composed and executed in a stack-like manner upon request.
Installation
Koa requires node v7.6.0 or higher for ES2015 and async function support. You need to have already installed Node.js.
You can quickly install a supported version of node.js with your favorite version manager:
$ nvm install 7
$ npm i koa
$ node my-koa-app.js
Hello World
This is the most basic example of a “Hello World!” app on Koa that listens on the port 3000.
const Koa = require('koa');
const app = new Koa();

app.use(async ctx => {
  ctx.body = 'Hello World';
});

app.listen(3000);
For every other path, the server will respond with 404 Not Found.
Advantages
- Koa improves interoperability, robustness, and makes writing middleware much more enjoyable.
- Has a large number of helpful methods but maintains a small footprint, as no middleware are bundled.
- Koa is very lightweight, with just 550 lines of code.
- Has a very good user experience.
- Better error handling through try/catch.
- Generated-based control flow.
- No more callbacks, facilitating an upstream and downstream flow of control.
- Cleaner, more readable async code.
Disadvantages
- The open source community around Koa is relatively small.
- Not compatible with Express-style middleware.
- Koa uses generators which are not compatible with any other type of Node.js framework middleware.
Performance
With Koa.js you can build web apps with great performance. This is because you can stop using callbacks, deal with errors faster, and because Koa itself is a very lightweight framework. As well as that, it makes the code management process easier.
It’s important to take into account the best practices for having a better performance in Node.js like running things in parallel, use asynchronous APIs in your code, keeping code small and light, and using gzip compression.
A simple “Hello World” app has the following performance request per second:
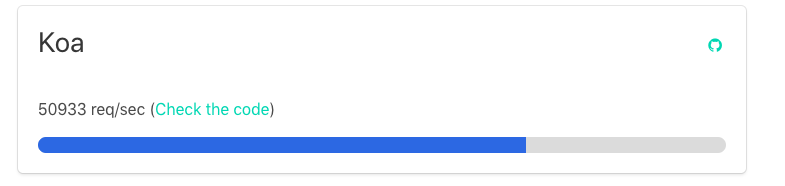
Security
There are different middlewares and headers for Koa that helps to improve the security, you can find them in the following link
Community involvement
You can join G+ koa Community, mailing list, contribute to Koa’s repo, join koa slack or start a discussion in hashnode.
Hapi
Hapi is a rich framework for building applications and services. It enables developers to focus on writing reusable application logic instead of spending time building infrastructure.
It is a configuration-driven pattern, traditionally modeled to control web server operations. A unique feature Hapi has is the ability to create a server on a specific IP, with features like the onPreHandler, we can do something with a request before it is completed by intercepting it and doing some pre-processing on the request.
Installation
To install hapi, you need to have Node.js installed and then:
npm install hapi
To save it to your package.json dependencies.
Hello World
The following example is the most basic hello world app using hapi:
'use strict';

const Hapi=require('hapi');

// Create a server with a host and port
const server=Hapi.server({
   host:'localhost',
    port:8000
});

// Add the route
server.route({
    method:'GET',
    path:'/hello',
    handler:function(request,h) {

       return'hello world';
    }
});

// Start the server
const start = async function() {

   try {
       await server.start();
   }
   catch (err) {
        console.log(err);
        process.exit(1);
    }

   console.log('Server running at:', server.info.uri);
};

start();
Then you just launch the application by running npm start and open localhost:8000/hello in your browser.
Advantages
- It provides a robust plugin system that allows you to add new features and fix bugs at a fast pace.
- It enables you to build scalable APIs.
- There is a deeper control over request handling.
- It is an excellent choice for building Representational State Transfer (REST) APIs because it provides you with routing, input, output validation, and caching.
- You can build an API that serves all kinds of clients that need mobile and single-page applications.
- Detailed API reference and good support for document generation.
- You can use hapi.js with any front-end framework, like React, Angular, and Vue.js to create a single-page application.
- Configuration-based approach to some sub-middlewares(pseudo-middlewares)
- Provides the availability of caching, authentication, and input validation.
- Has a plugin-based architecture for scaling.
- Provides really good enterprise plugins such as joi, yar, catbox, boom, tv, and travelogue.
Disadvantages
- Developers need to figure out the code structure on their own.
- “Locks” developers into using hapi-specific modules and plugins such as catbox, joi, boom, tv, good, travelogue, and yar; and which are not compatible with Express/Connect.
- Endpoints are created manually and must be tested manually.
- Refactoring is manual.
Performance
A 2017 study on Node.js frameworks, showed that hapi performed the worst compared to the other frameworks.
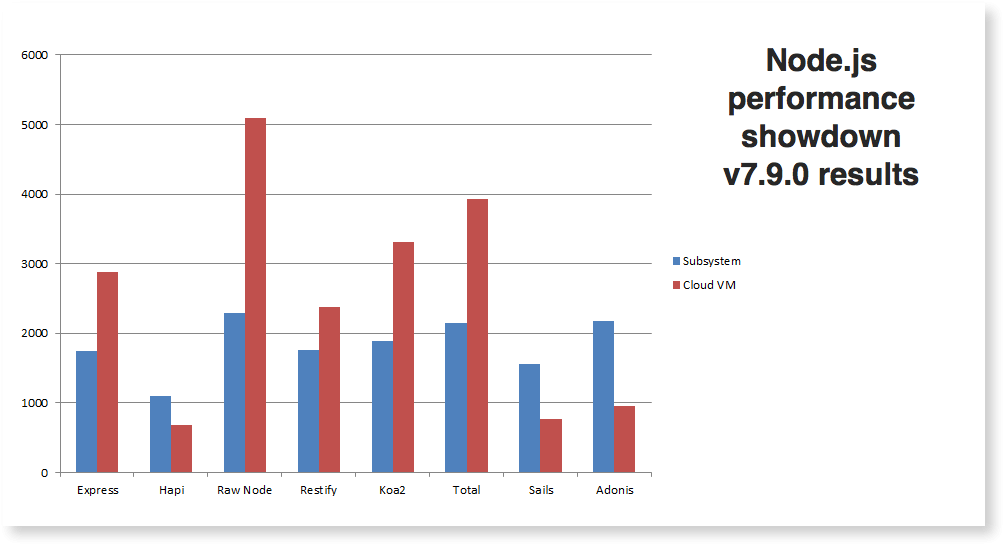
As we can see in the following graph compared to express. This test is consistent with past results. Express continues to maintain a performance edge over hapi. Applications with significant performance requirements should consider the advantage Express has over Hapi.
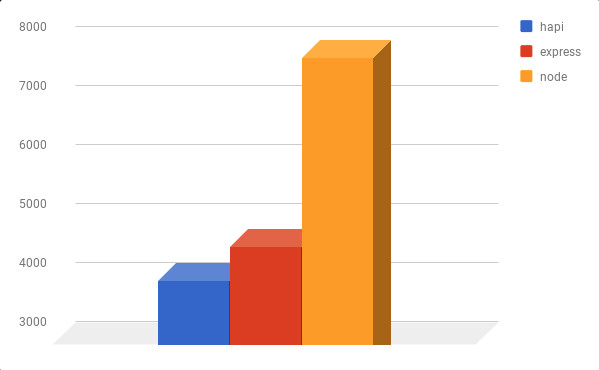
A simple “Hello World” app has the following performance request per second:
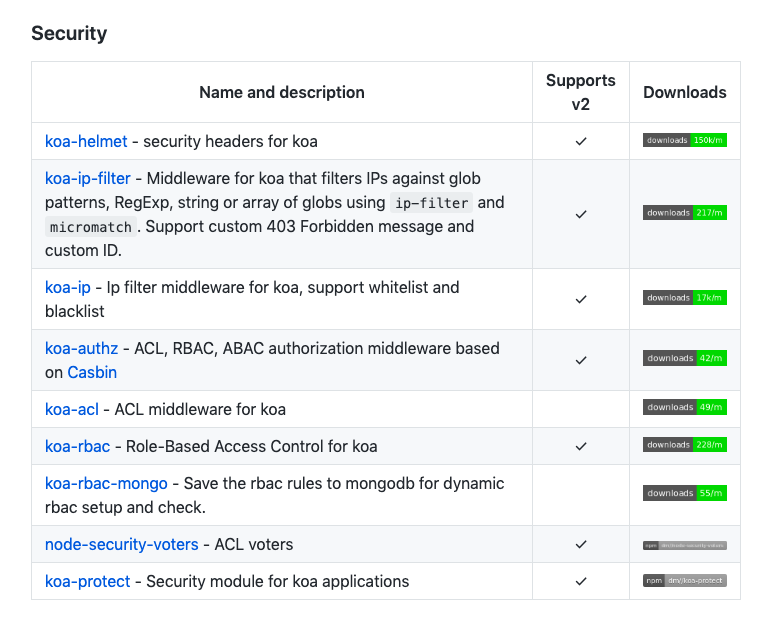
Security
Different plugins can help to improve hapi security:
Crumb: Anti cross-site-request-forgery (XCSRF) token generation and validation plugin. It works both with regular requests and CORS requests (OWASP recommends using CSRF protection, such as Crumb, along with CORS). Synopsys recommends using Crumb v3.0.0 or newer since a CSRF token leakage issue has been fixed when using Crumb with CORS enabled and the request origin does not match those specified in the CORS configuration.
Joi: Object schema description language and validator for JavaScript objects. Joi allows developers to define a schema for an object and then evaluate the object against that schema thus performing input validation for the object. Everything is defined and evaluated on the server-side so that the attacker cannot easily bypass this protection.
Hapi-rbac: Allows developers to implement role-based access controls easily. Broad enough to grant or deny access to entire groups; granular enough to grant or deny access to individual users.
Blankie: Allows developers to set the Content-Security-Policy header directives easily. The CSP is flexible enough that it may be implemented on a per route basis or across all routes.
Cryptiles: Provides general purpose cryptographic utilities for random number generation, encryption, hashing and fixed-time comparisons of hashes that are based on the Node.js crypto library.
Community involvement
You can join slack channel: hapihour.slack.com, visit the community page, community governance page and follow them on twitter to keep updated with the latest news.
Read More
In my previous blog post, I explored the differences, advantages, and disadvantages of three of the most popular Node.js frameworks: Express, Koa, and Hapi. In this blog post, I’m going to examine the differences between three more very popular frameworks: Next, Nuxt, and Nest. These three frameworks are server-side rendering, and they are closely related to React, Vue, and Angular (the three most widely used front-end frameworks), respectively.
-
The comparison is based on:
- Popularity (GitHub Stars and npm downloads).
- Installation.
- Basic Hello World app.
- Advantages.
- Disadvantages.
- Performance.
- Community involvement.
Next
Next is the most popular framework compared to the other two. It has more npm weekly downloads, GitHub stars and number of contributors.
Next.js is a React framework that lets you build server-side rendering and static web applications using React.
Installation
Install it:
npm install --save next react react-dom
and add a script to your package.json like this:
{
  "scripts": {
    "dev": "next",
    "build": "next build",
    "start": "next start"
  }
}
After that, the file-system is the main API. Every .js file becomes a route that gets automatically processed and rendered.
Basic Hello World app
Populate ./pages/index.js inside your project:
function Home() {
  return <div>Hello world!</div>;
}

export default Home;
Then just run npm run dev and go to http://localhost:3000. To use another port, you can run npm run dev -- -p <your port here>.
Advantages
- Every component is server-rendered by default
- Automatic code splitting for faster page loads
- Unnecessary code is not loaded
- Simple client-side routing (page-based)
- Webpack-based dev environment which supports Hot Module Replacement (HMR)
- Fetching data is very simple
- Can be implemented with Express or any other Node.js HTTP server
- It’s possible to customize with your own Babel and Webpack configurations
- Easy to deploy anywhere if Node.js is supported
- Built-in handling of search engine optimization (SEO) for pages
Disadvantages
- Next.js is not backend; if you need backend logic, such as a database or an accounts server, you should keep that in a separate server application
- Next is powerful, but If you’re creating a simple app, it can be overkill
- All data needs to be loadable from both the client and server
- Migrating a server-side app to Next.js is not a quick process, and depending on your project it may be too much work
Performance
To measure the performance, I used Apache Bench for benchmarking, which highlights how many requests per second the app is capable of serving. I also used lighthouse to audit performance, accessibility, best practices, and SEO.
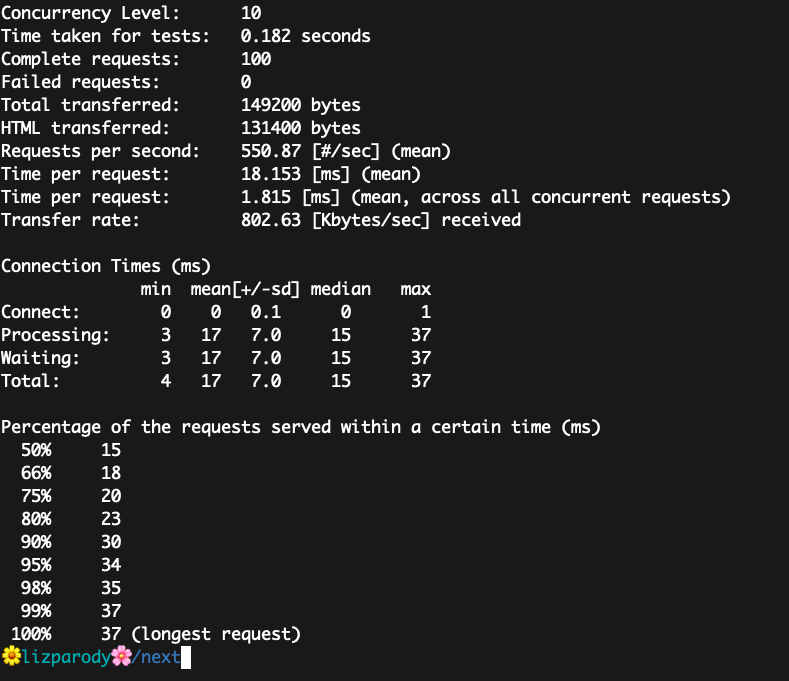
This is a basic Hello World app in Next.js. It handles 550.87 requests per second. This value is the result of dividing the number of requests by the total time taken. The average time spent per request is 18.153 ms.
Compared to the other two frameworks, Next.js scored better overall than Nuxt.js but worse than Nest.js
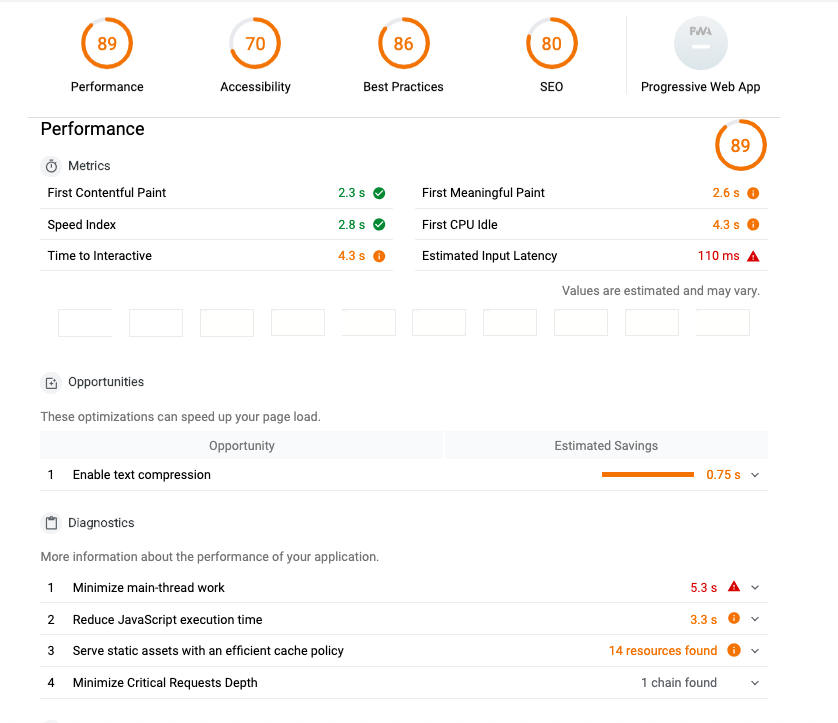
In the report provided by lighthouse, we can see that the performance, accessibility, best practices, and SEO scores are all above 70, which is good, but compared with the other two frameworks, it had the lowest score for Performance and has the highest score in Best Practices.
Community involvement
The Next.js community communicates through chat, slack, issues and pull request on GitHub.
Also, in the repo awesome-nextjs, there is a list of essentials, articles, boilerplates, extensions, apps, books, and videos that are useful for developers using Next.js
Nuxt
Nuxt is a Vue.js Meta Framework to create complex, fast, and universal web applications quickly.
Installation
Install it:
$ npm i nuxt
To create a basic app:
$ npx create-nuxt-app <project-name>
You can start directly with the CLI create-nuxt-app for the latest updates. Or you can start by using one of the starter templates: starter: Basic Nuxt.js project template express: Nuxt.js + Express koa: Nuxt.js + Koa adonuxt: Nuxt.js + AdonisJS micro: Nuxt.js + Micro nuxtent: Nuxt.js + Nuxtent module for content heavy sites
Basic Hello World app
This is the most basic example of a “Hello World!” app on Nuxt:
<template>
  <div>
    <h1>Hello world!</h1>
    <NLink to="/about">
      About Page
    </NLink>
  </div>
</template>

<script>
export default {
  head: {
    title: 'Home page'
  }
}
</script>
Advantages
- Its main scope is UI rendering, while abstracting away the client/server distribution
- Statically render your Vue apps and get all of the benefits of a universal app without a server
- Get automatic code splitting (pre-rendered pages)
- Setup via the command line with the starter template
- Get great project structure by default
- Easily set up transitions between your routes and write single file components
- Get ES6/ES7 compilation without any extra work
- Get set up with an auto-updating server for easy development
- Powerful Routing System with Asynchronous Data
- Static File Serving
- ES6/ES7 Transpilation
- Hot module replacement in Development
- Pre-processor: Sass, Less, Stylus, etc.
Disadvantages
- It has a smaller community, which means fewer resources and potentially less extensive documentation
- Lack of some common solid plugins/components. (Google maps, calendar, vector maps). Some components for that exist, but they are generally not very well maintained.
- It is necessary to go deep in more complex components/plugins. If you want to develop something very flexible, you have to get down to render functions/jsx to do that. (e.g render the contents of a slot in another place/component).
- Props have to be specified explicitly. There might be cases when you want to transform some CSS classes to props; you’ll have to specify these props or use $attrs / render functions or jsx.
- Reactivity caveats like setting an item from an array directly
this.items[key]=valueor adding a new data property. - High traffic may put strain on your server
- You can only query and manipulate the DOM in certain hooks
Performance
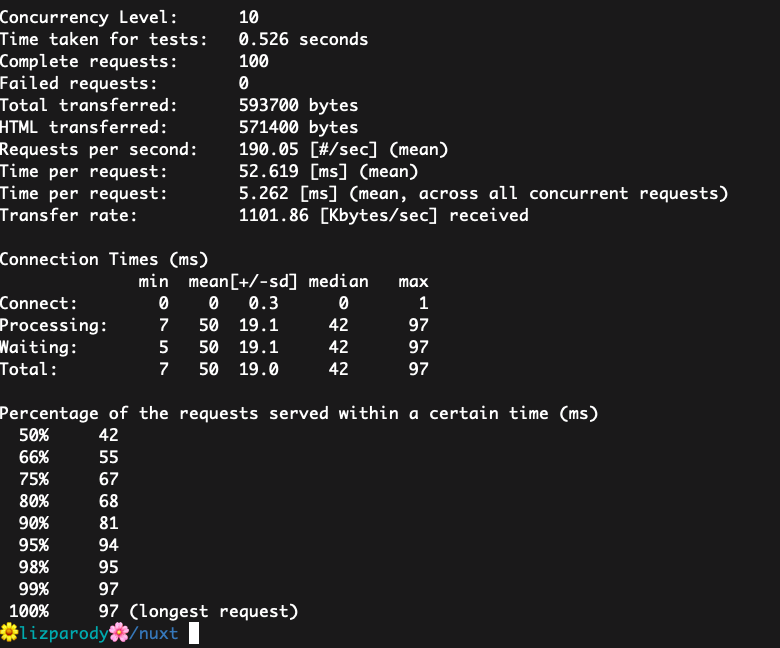
This is a basic Hello World app in Nuxt.js. It handles 190.05 requests per second. The average time spent per request is 52.619 ms. On this metric, Nuxt.js performs the worst compared to the other two frameworks.
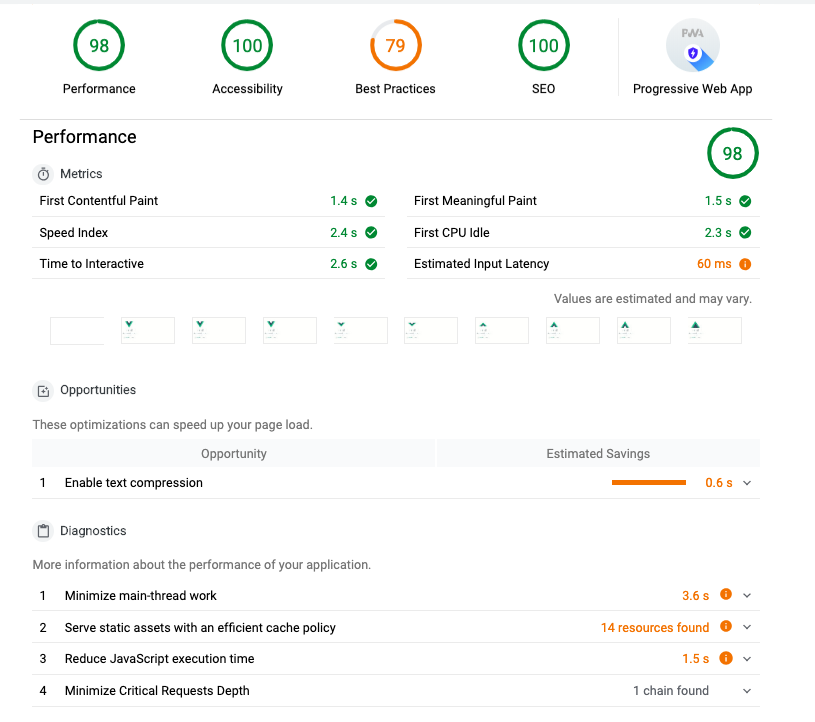
Nuxt.js has the highest score in three of the four measures; performance, accesibility and SEO.
Community involvement
There is a GitHub organization where you can find modules and projects from the Nuxt.js community. There is also a curated list of awesome things related to Nuxt.js awesome-nuxt including Modules, tools, mention of Nuxt.js, showcase, tutorials, blogs, books, starter template, official examples, and projects using Nuxt.js.
The community communicates through Gitter Chat Room, Telegram, Russian community, Discord, Twitter and YouTube Channel
Nest
A progressive Node.js framework for building efficient, scalable, and enterprise-grade server-side applications on top of TypeScript and JavaScript (ES6, ES7, ES8), Nest is heavily inspired by Angular.
Nest is a framework for building efficient, scalable Node.js server-side applications. It uses modern JavaScript, is built with TypeScript (preserves compatibility with pure JavaScript) and combines elements of OOP (Object Oriented Programming), FP (Functional Programming), and FRP (Functional Reactive Programming).
Under the hood, Nest makes use of Express, but also provides compatibility with a wide range of other libraries, like e.g. Fastify, allowing for easy use of the myriad third-party plugins which are available.
Installation
Install it:
$ npm i @nestjs/cli
$ nest new project-name
Alternatively, to install the TypeScript starter project with Git:
$ git clone https://github.com/nestjs/typescript-starter.git project
$ cd project
$ npm install
$ npm run start
Basic Hello World app
After installing Nest.js with the npm cli command, and creating a new project with nest new project-name, a src/ directory will be created and populated with several core files, including main.ts.
The main.ts includes an async function, which will bootstrap our application:
import { NestFactory } from '@nestjs/core';
import { ApplicationModule } from './app.module';

async function bootstrap() {
  const app = await NestFactory.create(ApplicationModule);
  await app.listen(3000);
}
bootstrap();
And then to run the app that listens on port 3000, you execute:
$ npm run start
Advantages
- As a TypeScript-based web framework, strict type definition is possible
- The framework is very annotation-driven, with everything from endpoints to Swagger documentation being generated from them. The endpoints are clean and simple, and the annotations make developing simpler all around.
- The folder structure in Nest.js is heavily based on Angular. This allows for minimal downtime when first designing a Nest service.
- Because Nest.js is a module-based framework, it’s easyto externalize general-purpose modules and reuse code in multiple projects
- Components get their own folders, with an application module and main file residing in the root. This simple structure allows more attention to be paid to the design of endpoints and their consumers, instead of application structure.
- Nest.js uses the latest version of TypeScript, which helps ensure that it will remain relevant in the rapidly changing JavaScript landscape and gives developers less context switching. The transition from Angular code to Nest is relatively easy.
- Similar to Angular, Nest also has a decent command line tool, available through Node Package Manager, nestjs/cli. The command line tool will let you scaffold the project, generate Nest architecture components, and display project information.
Disadvantages
- The largest risk facing Nest users is the lack of documentation. The framework has great integrations with other frameworks but the documentation is minimal and doesn’t cover any issues that may arise.
- Nest does hold an edge in its use of TypeScript and relation to Angular, but it doesn’t have the backing power of a large enterprise behind it.
- Overall, Nest has a smaller community compared to other frameworks
Performance
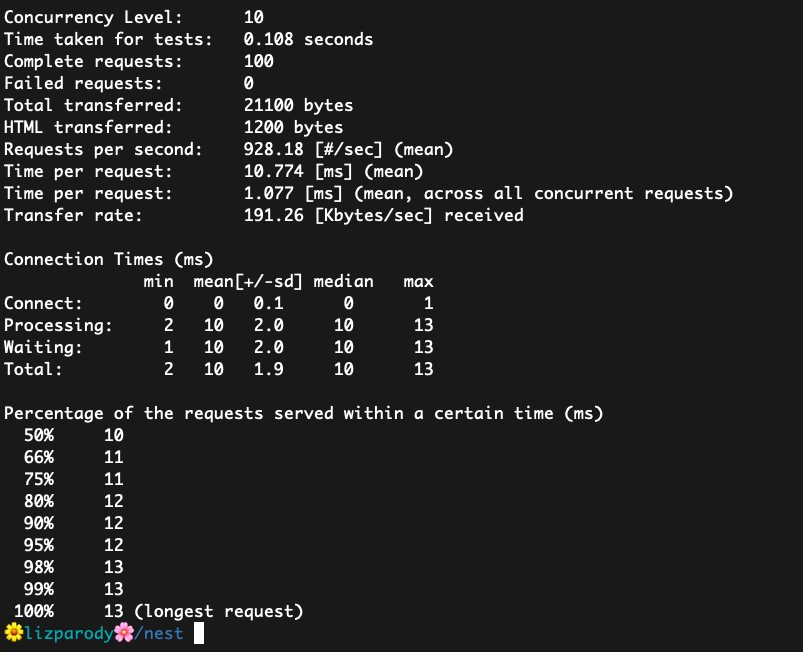
This is a basic Hello World app in Nest.js. It handles 928.18 requests per second. The average time spent per request is 10.774 ms. On this metric, Nest.js performed the best out of the three frameworks we compared.
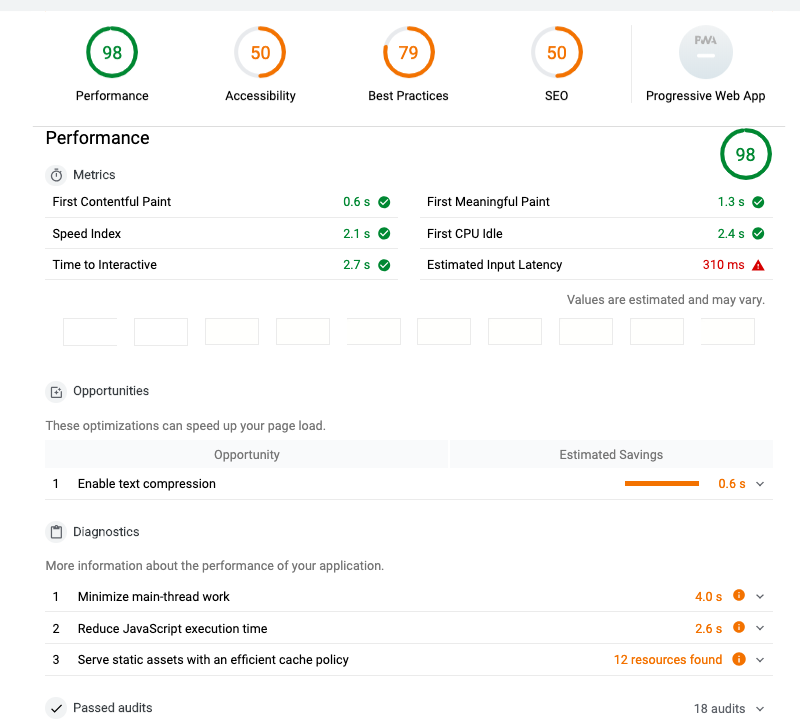
In the report provided by lighthouse, Nest.js has a very high performance, but scored comparatively lower on other key factors:accessibility, best practices and SEO.
Community involvement
There is a group of developers providing handy packages on NestJS Community organization GitHub. Some of their popular packages are: nestjs-config, a config module for NestJS using dotenv. nest-access-control, Role and Attribute-based access control for NestJS and nestjs-flub, pretty error stack viewer.
Even if Nest is not the most popular framework, is the one that has the better performance and has many advantages. You should give it a try!
The community has a spectrum chat and Twitter
Read More